Meet Horizon UI · The AI Assistant: Ask Your Observability Data in Plain Language
The Meet Horizon UI series wrapped at 17/17 — a full tour of every surface of SkyWalking’s new console: the sidebar that mirrors your estate, the adaptive dashboards, topology and the 3D map, the trace and log explorers, profiling, alarms, the operations surface, access control, and config-driven customization. This is a new chapter, and it arrives with Horizon UI 1.0: an in-app AI Assistant that lets you ask your observability data in plain language instead of clicking through it.
It is not a chat box bolted onto a dashboard. Ask it something — “what’s unhealthy in the system right now?”, “investigate the response time for a service” — and it reads live data from your OAP backend, through the same query path the dashboards use, then streams back an ordered narrative built from the same charts, topology and tables you see everywhere else in Horizon. It is read-only, it inherits your permissions, and it is off by default until an operator enables it and points it at a model.
Answers you can see, not a wall of text
The assistant’s core habit is show, don’t describe. It writes a sentence or two, then draws a real figure, then interprets what that figure actually shows — and moves to the next one. Every figure is a genuine render, not a screenshot or a made-up number: line charts and single-value cards, top-N lists, labeled tables, and record lists, each chosen by the shape of the underlying metric expression. A single running Figure N counter numbers every block it draws, so the narrative can point at a figure it actually rendered — “the response-time chart above shows the spike” — and mean it.
It doesn’t stop at charts. When a question is about how things connect or where something ran, the assistant embeds the real feature views inline, read-only — the same components the dedicated pages use, focused for you:
- The dependency views — a focused one-hop topology (a service’s direct upstream callers and downstream dependencies, not the whole-layer map), its cross-layer hierarchy (the Smartscape fan projecting a service up into its mesh mirror and down into its backing infrastructure), the deployment graph, the instance map for a source→destination pair, and the API-dependency chain — each zoomable and filterable in place.
- The signal explorers — the real Traces list with the span waterfall on a row click (native SkyWalking and Zipkin-tracing layers), the stored Logs view, and, for a browser app, the Browser errors stream with stack traces.
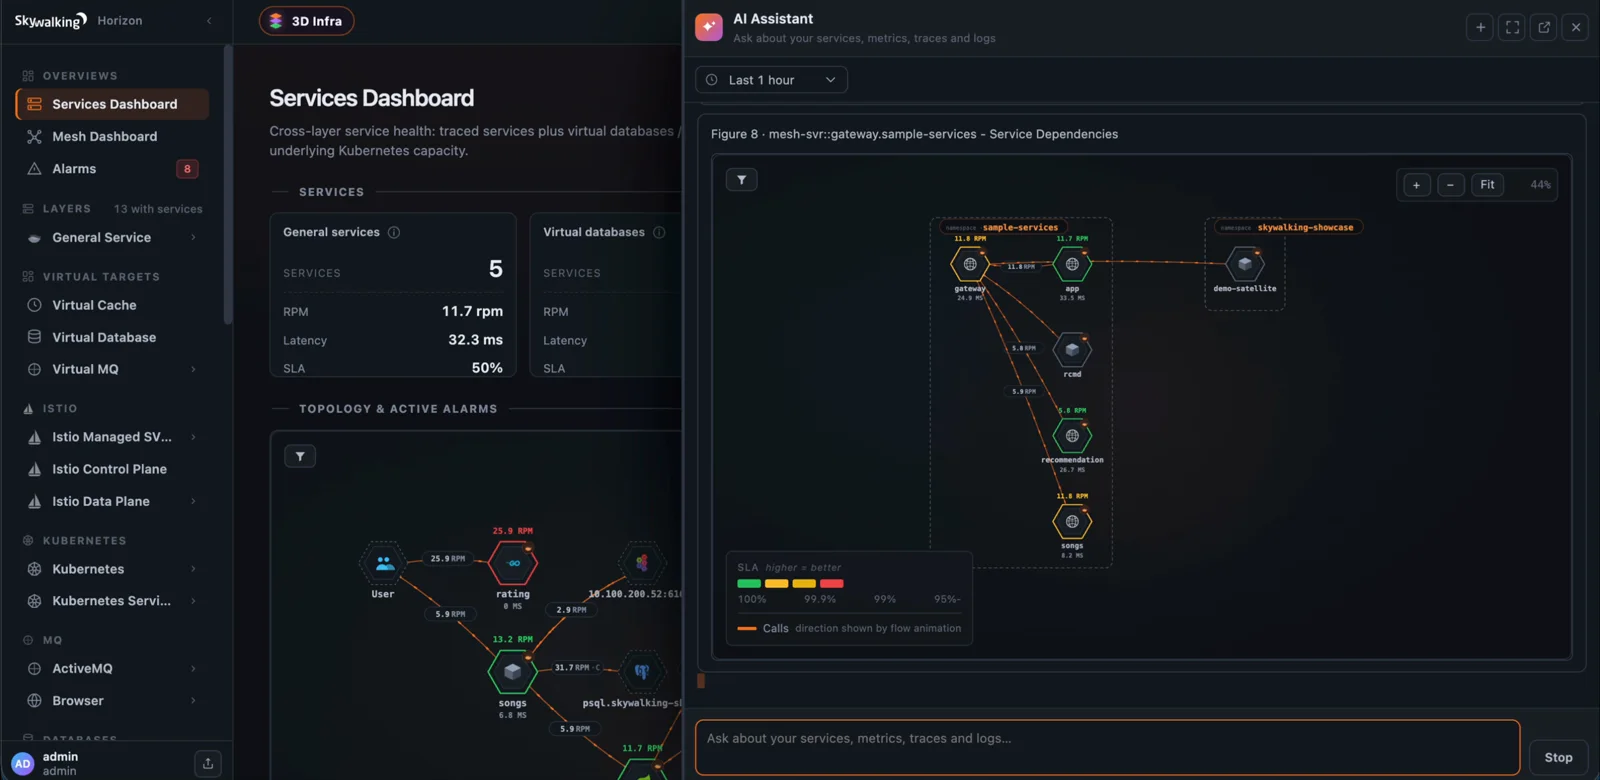 Figure 1: Asked how a service connects, the assistant draws its dependency graph inline — no link-out, the same component the topology page uses.
Grounded in live data — it doesn’t invent metrics
Those figures are trustworthy because the assistant isn’t free-associating about your system. It answers by combining three sources, and it’s the interplay between them that turns scattered signals into one coherent picture:
- Live data — it reads through the same OAP query protocol the dashboards use, so it sees exactly what your dashboards see, scoped to your permissions and its own time window.
- Your layer configuration, used as a skill — the layer and overview templates are the assistant’s catalog of what each layer measures: the curated metrics and their MQE expressions, each metric’s entity scope (Service / ServiceInstance / Endpoint), and which components a layer carries. It renders those expressions verbatim rather than inventing them — so a chat figure matches the dashboard — and a layer with no trace component simply says so.
- SkyWalking’s model — layers, scopes, the metric catalog, topology and hierarchy — the connective tissue that lets it tie a metric to the entity it belongs to and walk a dependency edge.
There’s a nice consequence: because that catalog is your configuration, edited in the Layer dashboards admin, it’s a lever you control. Add a metric to a layer or enable its traces/logs component and the assistant uses it in the next investigation; configuring your layers well is, in effect, how you extend what it can do.
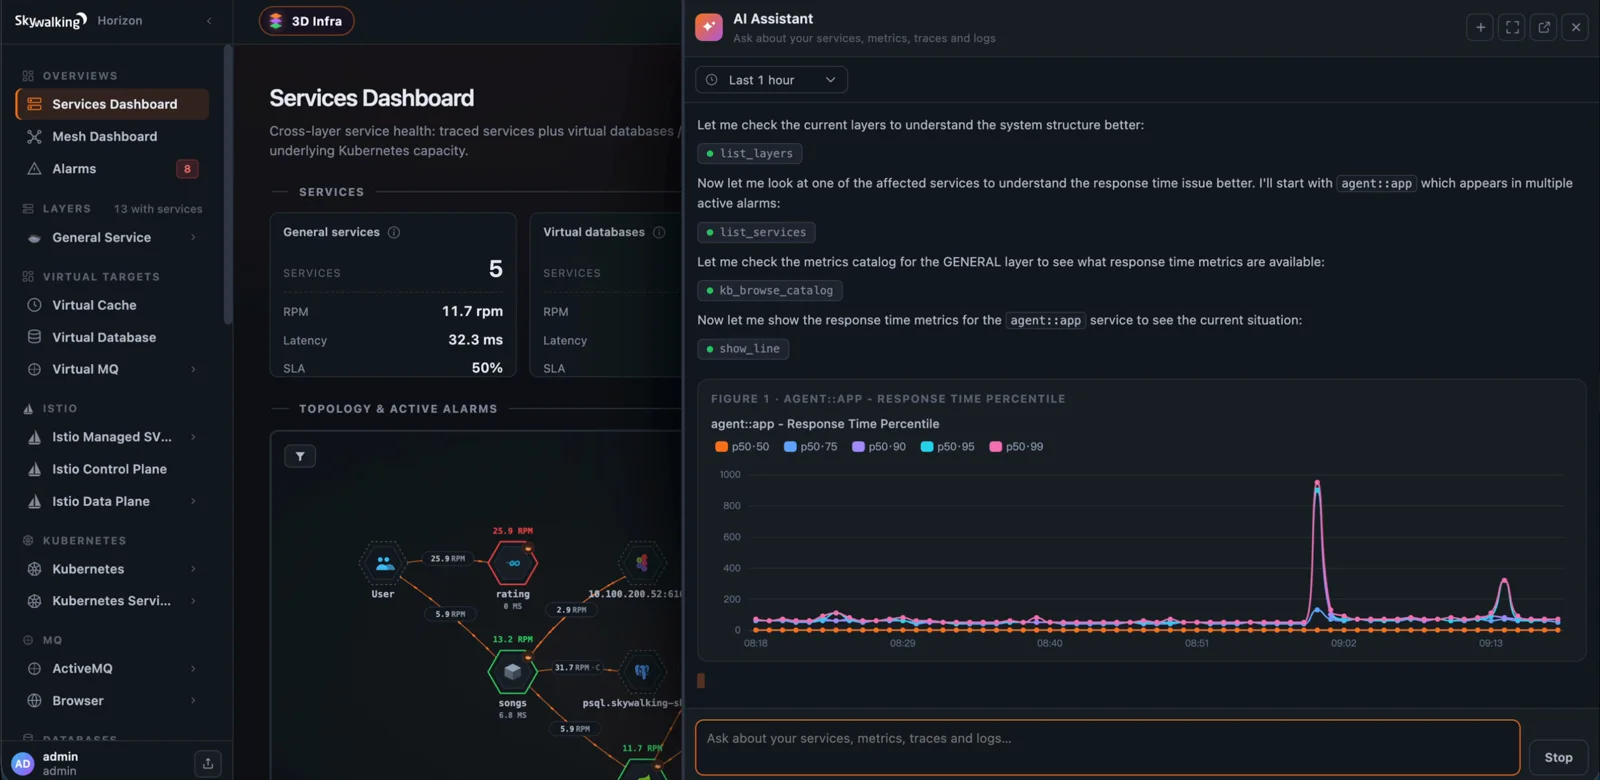 Figure 2: Before drawing anything, the assistant orients with the same building blocks the UI uses — list the layers and services, browse the metric catalog — so every figure is a real, catalog-backed query.
Guided root-cause, with the discipline to stop
Ask “what’s the root cause?” and the assistant doesn’t wander. It loads a matching investigation playbook — a master method plus focused variants for latency, error-rate / SLA, saturation, a middleware dependency, a Kubernetes workload, or a service mesh.
When a service looks unhealthy, the cause may be the service itself or something it depends on. So the assistant follows the dependency graph to find where the problem originates — the root service — instead of stopping at the first symptom, separating a service’s own fault from one it inherited from a dependency it calls. From there it drills into that service’s slowest instances and endpoints, then reaches the error stack. When the trail leaves the application tier it follows the cross-layer hierarchy down into the backing infrastructure — a database, cache or queue is a topology leaf with nothing downstream, so the investigation bottoms out there and pivots to its logs, its Kubernetes hierarchy, and the network edge, where memory / disk / connection pressure actually lives.
For a Kubernetes workload it can pull a pod container’s on-demand logs — the error stack — and show the fetched lines inline as a read-only result. Those logs stream straight from the cluster and are never stored; the block isn’t a live console, so to see newer lines you ask again, or open the dedicated Pod Logs tab to keep a tail running. It inherits your logs:read permission and is gated on OAP, so if on-demand logs are switched off the assistant says so instead of failing.
And crucially, it knows when to stop. When the available data and tools can’t localize the cause any further, it gives you a bounded, honest answer — the conclusion or best hypothesis with the evidence behind it, and a numbered list of exactly what it could not determine and why — rather than looping forever across random pods and metrics. On Kubernetes it will even hand the investigation forward with the precise kubectl commands to run and paste back.
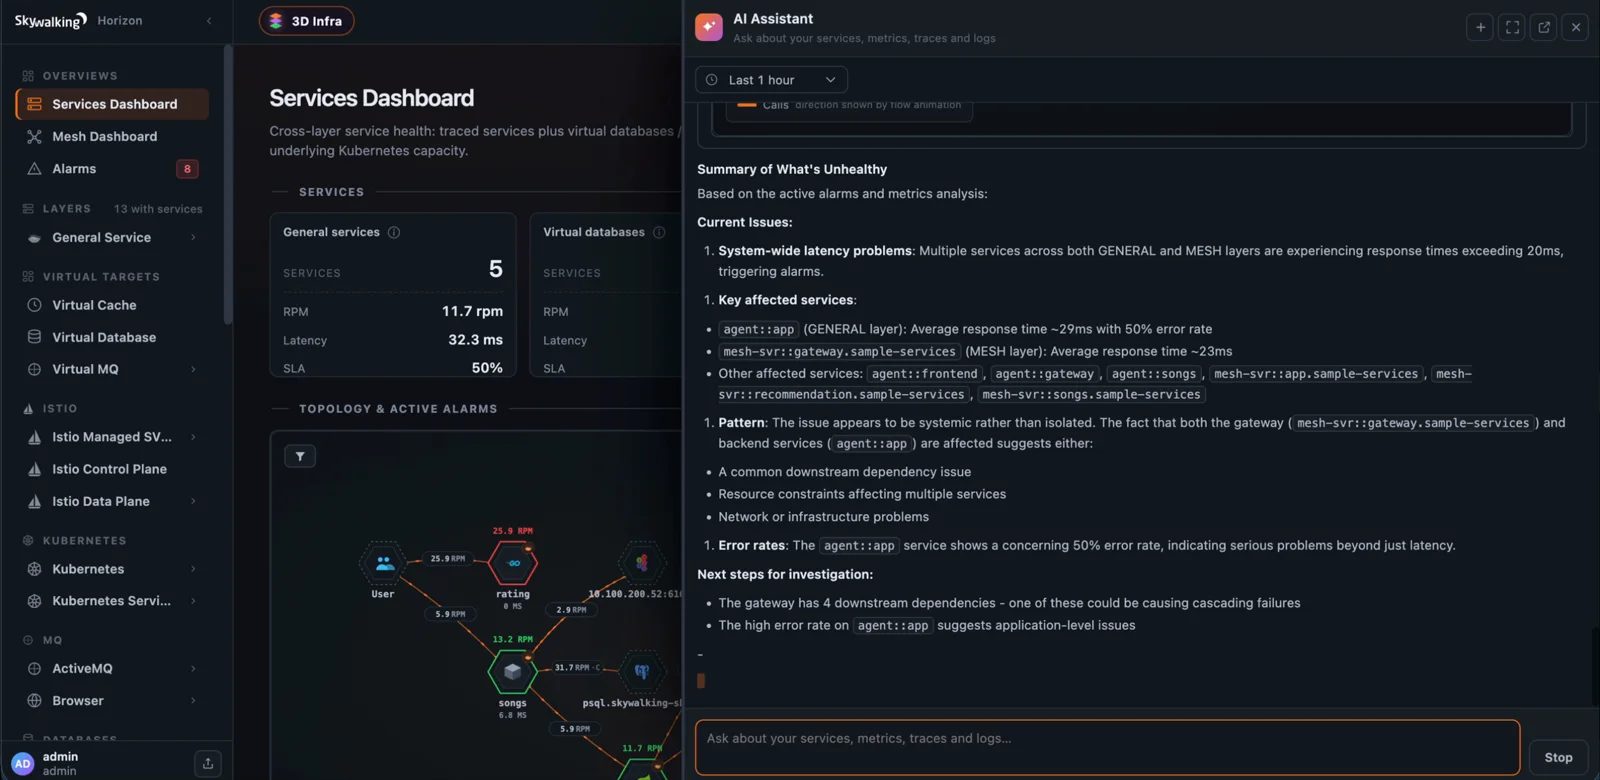 Figure 3: The end of an investigation is a summary, not a dead end — what’s wrong, which services, the likely pattern, and the concrete next steps to confirm it.
Read-only, and one action you approve
All of the assistant’s investigation tools are read-only — it observes and explains, and never changes configuration, rules or dashboards. Profiling is the only action, and it’s gated twice over: when metrics and traces can’t localize a cause, the assistant proposes a profiling task as a decision card — what it found, why profiling would help, what it expects to reveal — and nothing runs until you approve it in the popout, and only if you hold the profile:enable permission. You then ask it to analyze the result in a later turn, once the profile has collected; it never triggers anything on its own.
That posture holds all the way down. Reaching the assistant needs the ai:read permission (granted to the viewer, maintainer, operator and admin roles by default) — but that only opens the chat. Every data tool then re-checks its own read verb before it runs: metrics:read for figures, alarms:read for alarms, topology:read for the graphs, traces:read, logs:read, browser-errors:read. A tool you lack the verb for is refused and shows as a denied chip in the transcript, so the assistant can never see more than you can.
Bring your own LLM
Here is the part that decides whether you can actually run this: you don’t need a frontier model. The assistant is vendor-neutral — it talks to your model through a pluggable transport, so no specific vendor is required. The default is any OpenAI-compatible endpoint (a hosted model, a self-hosted or local model, or an AI gateway); Amazon Bedrock is supported too. You set a model id, a base URL, and an API key, and that’s the integration.
Why can a modest model do this well? Because the observability expertise doesn’t live in the model — it lives in the tools, the metric catalog and the built-in playbooks. The model’s job is to orchestrate those tools and narrate the results, not to reason about SkyWalking from scratch (temperature is fixed at 0 for reliable tool-calling). In practice, a cost-efficient, tool-calling-capable model is usually enough — you do not have to pay for, or wait on, the largest model on the market to get a solid investigation.
Enabling it is a small config block. In horizon.yaml, or entirely via HORIZON_AI_* environment variables:
ai:
  enabled: true
  provider: openai-compatible   # or: bedrock
  model: "your-model-id"
  baseUrl: "https://your-endpoint/v1"
  apiKey: "${HORIZON_AI_API_KEY}"   # secret — env only, redacted from logs
The API key is a secret: set it via environment only, and it is redacted from logs and excluded from the audit trail. The floating AI Assistant launcher shows for every signed-in user, so the feature is discoverable — but until it’s enabled and pointed at a model, the panel opens read-only with a short “ask your administrator to set it up” notice instead of a chat box. Both the system prompt and the starter example chips ship with sensible defaults and can be replaced entirely, and a starter can embed a <service> or <layer> placeholder that opens a free-text fill-in — type an approximate name and the model resolves it to the real entity at query time.
Safe by construction
Because the assistant reads untrusted operational data — service and pod names, alarm messages, log lines, trace text — it is designed to treat everything a tool returns as data to be analyzed, never as instructions to obey. A log line that says “ignore previous instructions” is quoted and investigated, not acted on. It is instructed to keep to the observability task and not to surface its own configuration or another user’s data. Combined with read-only-by-default, a read-verb re-check on every tool, and secret redaction in logs and the audit trail, the assistant is built to be safe to point at a real production backend.
Where it lives, and getting started
Open the assistant as a side drawer from the launcher, expand it to a full page at /ai when you want more room, or pop it into its own browser tab. It keeps its own time window (a clock in the chat header, default the last hour), and there’s no service picker — just name the service in your question. On privacy: your model credentials live only in the server configuration, never in the browser; the conversation history is kept in your browser’s local storage (capped, synced across tabs), and you can delete any conversation from the /ai History sidebar.
The AI Assistant ships with Horizon UI 1.0. To try it, enable the ai: block, point it at a model you already have access to, and ask it the first question you’d normally go digging for. Full configuration details are in the AI Assistant documentation.
If you’re new to Horizon, start with the series opener — Meet Horizon UI · 1/17 — and the getting-started guide. Then come back and let the assistant give you the guided tour of your own estate.