Meet Horizon UI · 6/16: The Trace Explorer
This is the sixth post in the Meet Horizon UI series. The last few were maps — topology between services, the deployment inside one, the 3D view of the whole estate. Those answer “what does my system look like.” This post is about the opposite move: from an aggregate down to one request — its spans, its timing, the exact hop that went slow. That’s the Traces tab.
Built for triage, not tailing
The Traces tab is a distributed-trace explorer that lives inside a layer: pick a service, set your conditions, and read a single trace’s span timeline. And it behaves differently from the rest of the console on purpose — because traces are triage data, not a live feed.
It owns its own time range and conditions. It does not follow the global topbar time picker, and it does not auto-refresh. You stage what you’re looking for and press Run query; nothing is fetched until you do. Before the first run the list simply says “Pick your conditions, then click Run query.” When you’re chasing one bad trace from twenty minutes ago, the last thing you want is the page sliding forward under you every few seconds — so it doesn’t.
Conditions, not a query language
The whole filter surface is structured form controls — selects, number ranges, and tag chips — staged in a toolbar that only takes effect on Run query:
- Instance and Endpoint narrow within the service (the endpoint dropdown lists the service’s own endpoints).
- Status —
ALL/SUCCESS/ERROR. - Order — Newest (by start time) or Slowest (by duration).
- Limit — how many rows to pull (30 by default); the BFF caps the page size server-side so a client can’t ask OAP for the world.
- Time range — a rolling preset (last 15 minutes through 24 hours) or a custom absolute window, evaluated at second precision so a trace that just finished still falls inside it instead of being rounded off the minute.
- Trace ID — paste one to look it up directly.
- Duration range — a min–max in milliseconds.
- Tag — free-form span tags as
key=value(e.g.http.status_code=500), added with Enter as removable chips and AND-joined; keys and values get typeahead from the backend.
One thing this is not: a query language. There’s no TraceQL box anywhere in Horizon — the structured conditions above are the entire surface. (TraceQL is a separate path: SkyWalking’s backend can serve traces to Grafana over TraceQL, which is its own story. Horizon’s explorer is forms, not a DSL.)
A distribution you can box-select
When the results come back, the toolbar is joined by a Distribution chart: one dot per trace, plotted with start time on the X axis and duration as its height — slower traces sit higher. Dots are colored by status — errors in red, successes in the accent color — so a cluster of red high up is exactly the “slow and failing” corner you came to find.
The chart is also a filter. Click a dot to pick it, or drag a box across a band of them, and the result list narrows to just that selection — the header switches to an “N picked” count with a Reset. This is a client-side filter over what’s already loaded; it never issues a new query. Dragging a band across the slow-and-erroring corner and reading only those rows is the fastest way to go from “200 traces” to “these six.”
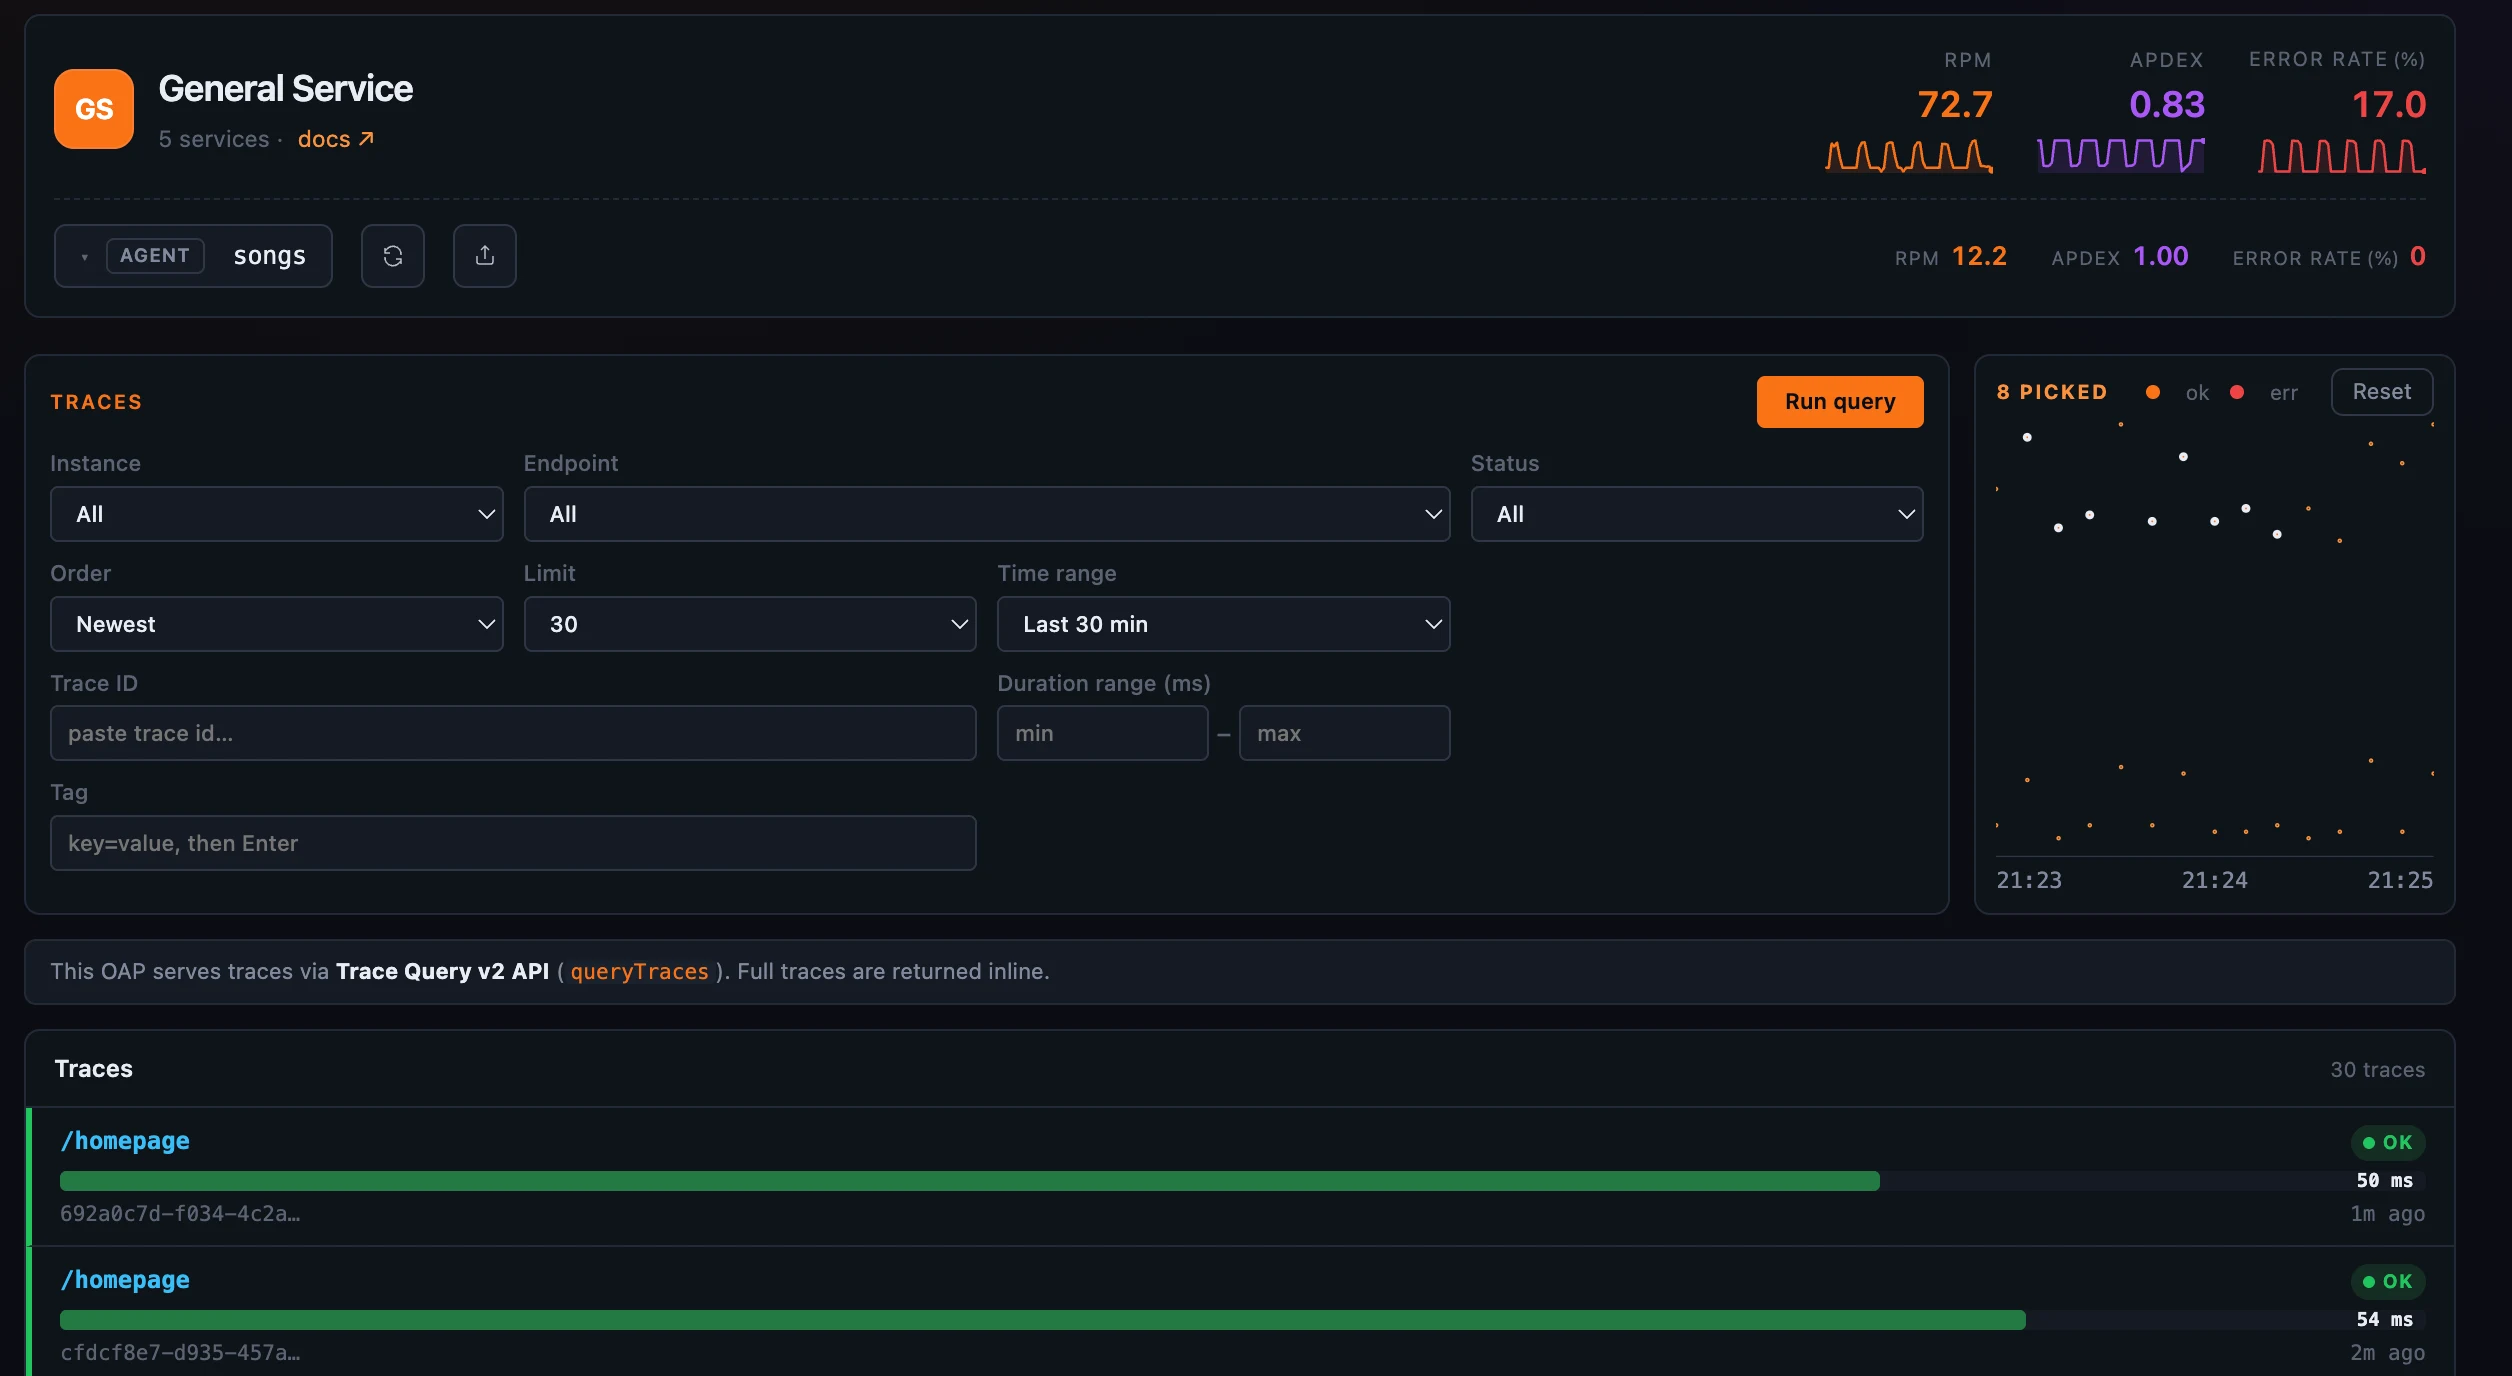 Figure 1: Stage conditions, run the query, then box-select a band of the distribution to whittle the list down to the traces worth opening.
Each result row shows the trace’s root endpoint, an OK/ERR flag, the duration, and a bar sized against the slowest trace in the set. What a row represents depends on the storage backend, and Horizon detects it for you: a banner reads either “Full traces are returned inline” (the backend returns whole traces with their spans, so a click opens immediately) or “Each row is a trace segment — click one to fetch its full trace.” You never configure this; the banner just tells you which you’re looking at.
Three ways to read one trace
Click a row and the trace opens with a three-way view toggle — Default, Tree, and Statistics — over the same spans:
- Default is the span waterfall: one indented row per span, each carrying a service-colored bar positioned and sized by the span’s start offset and duration on a shared timeline, a span-kind glyph, the component’s icon (the same icon set the topology map uses), the endpoint or peer name, and the span’s own duration. Errored spans are highlighted, and a flag marks any span carrying attached events. Crucially, the waterfall stitches spans across segments using their parent references, so a request that crossed five services renders as one connected timeline rather than five disjoint ones.
- Tree draws those same spans as a zoomable, pannable node graph — root on the left, callees flowing right — for when you care about the shape of the call tree more than the exact timing.
- Statistics rolls the spans up by name: a sortable table of count and total / average / maximum duration per operation, so “which span am I spending all my time in, across every occurrence in this trace” is one sort away.
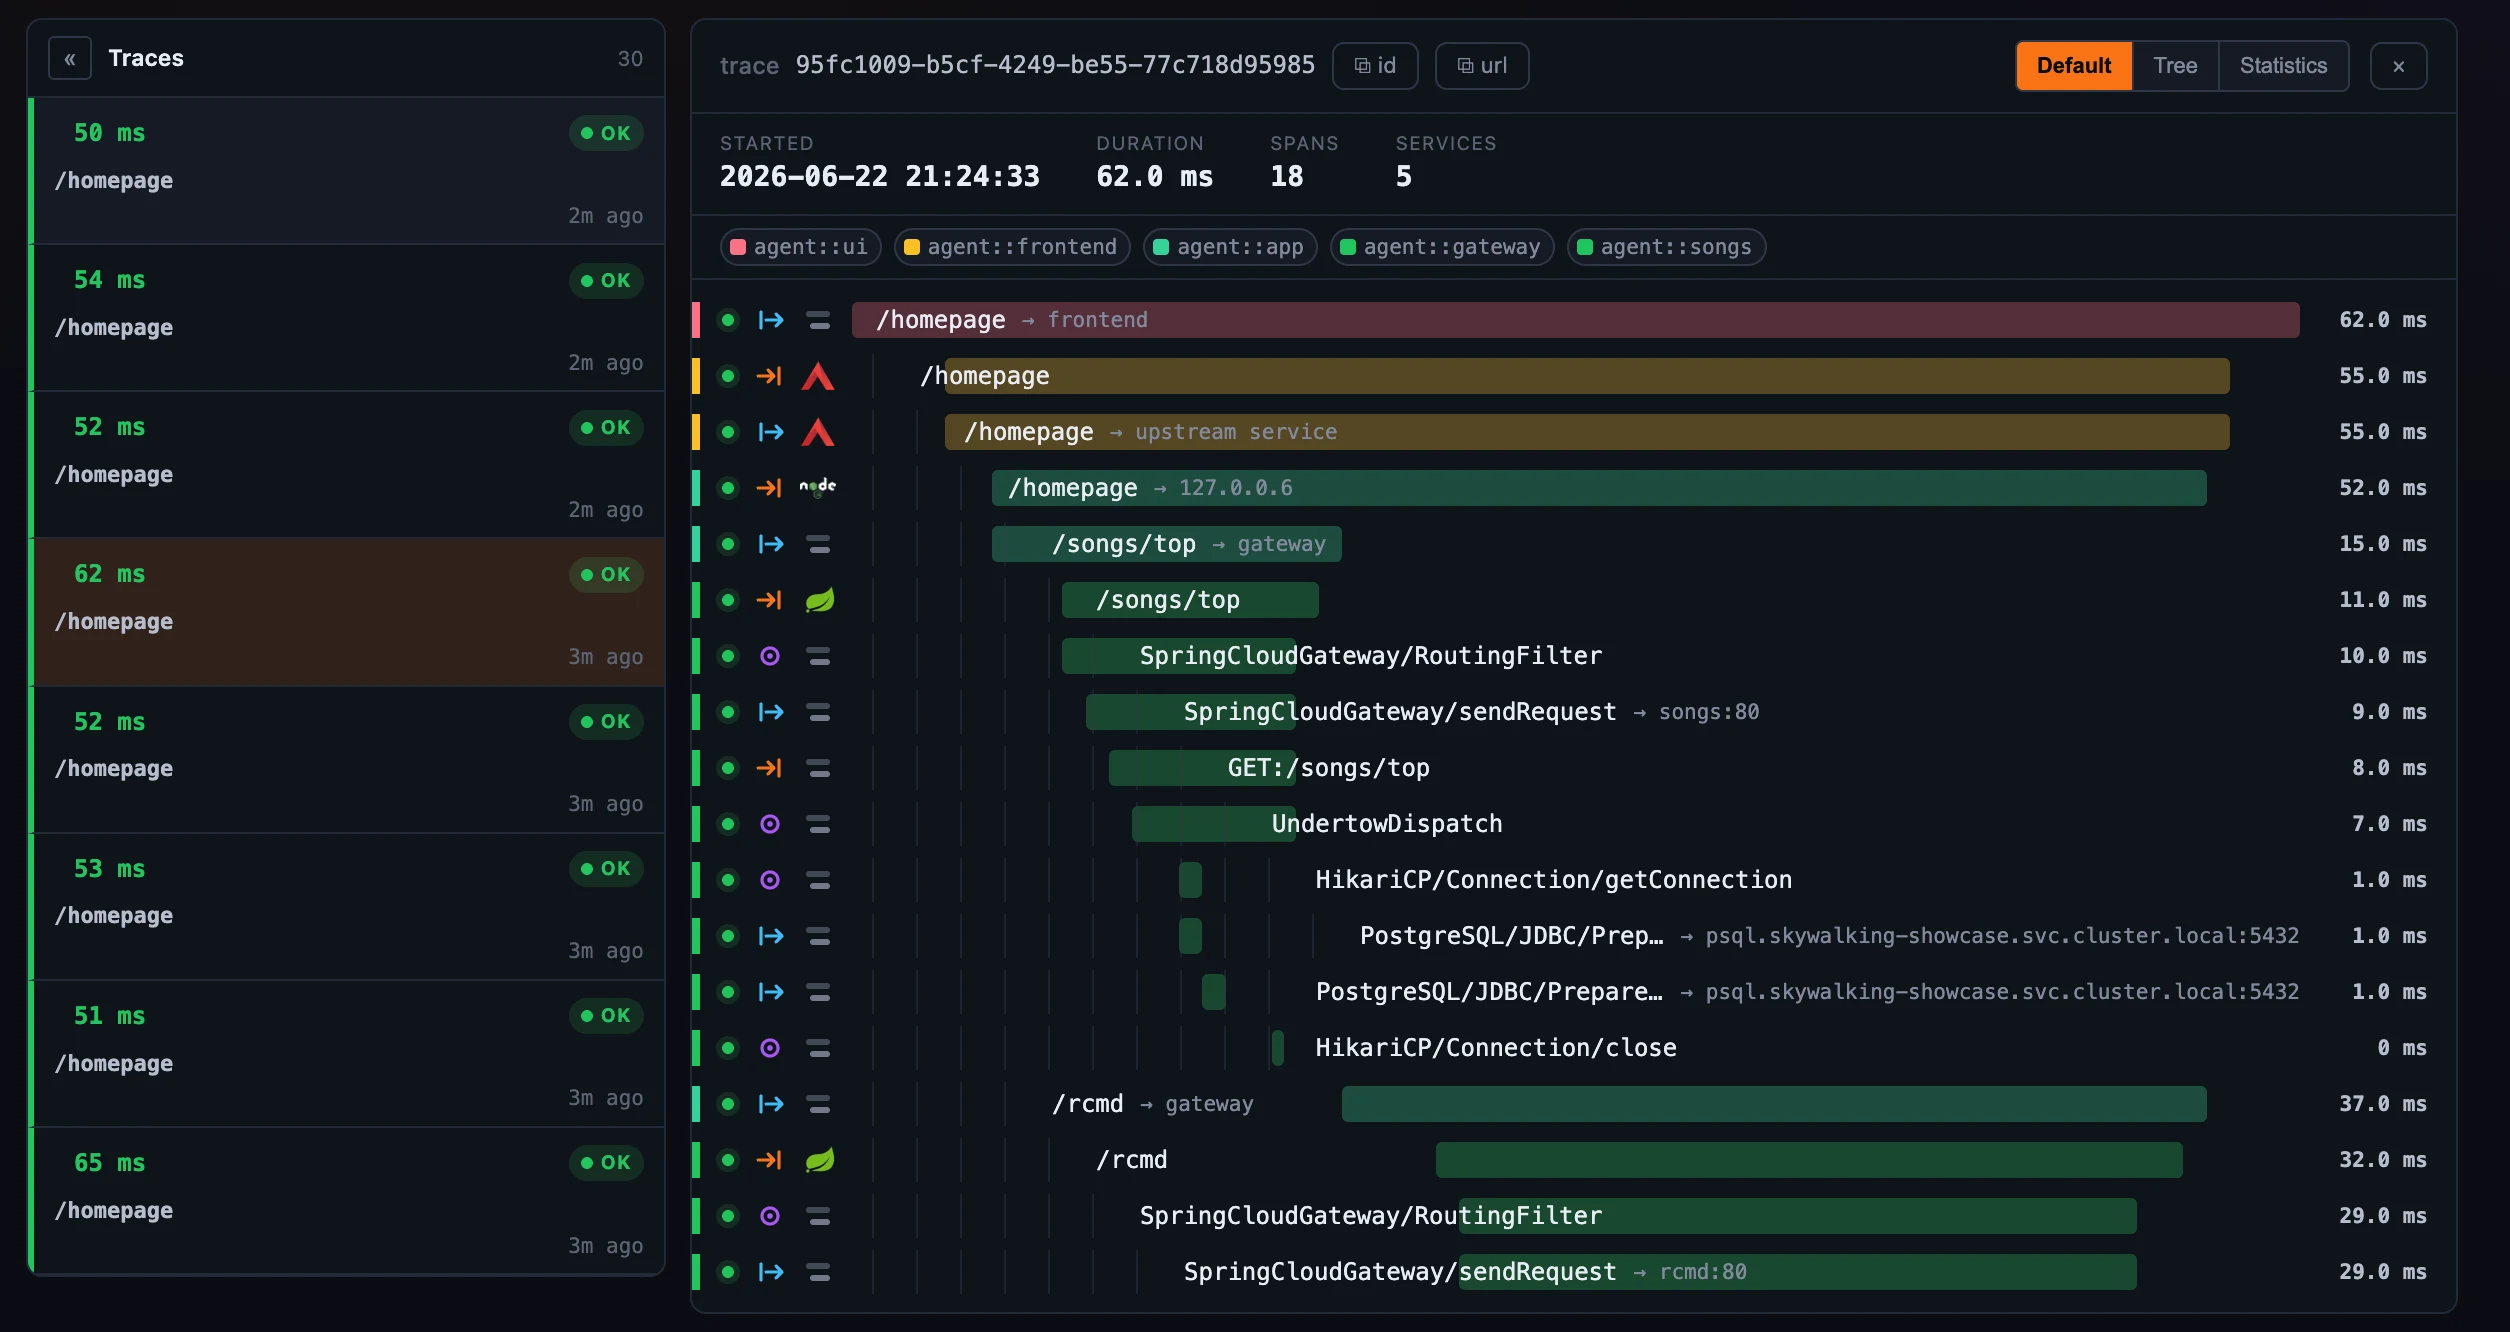 Figure 2: The waterfall (Default) — one connected timeline across every service the request touched.
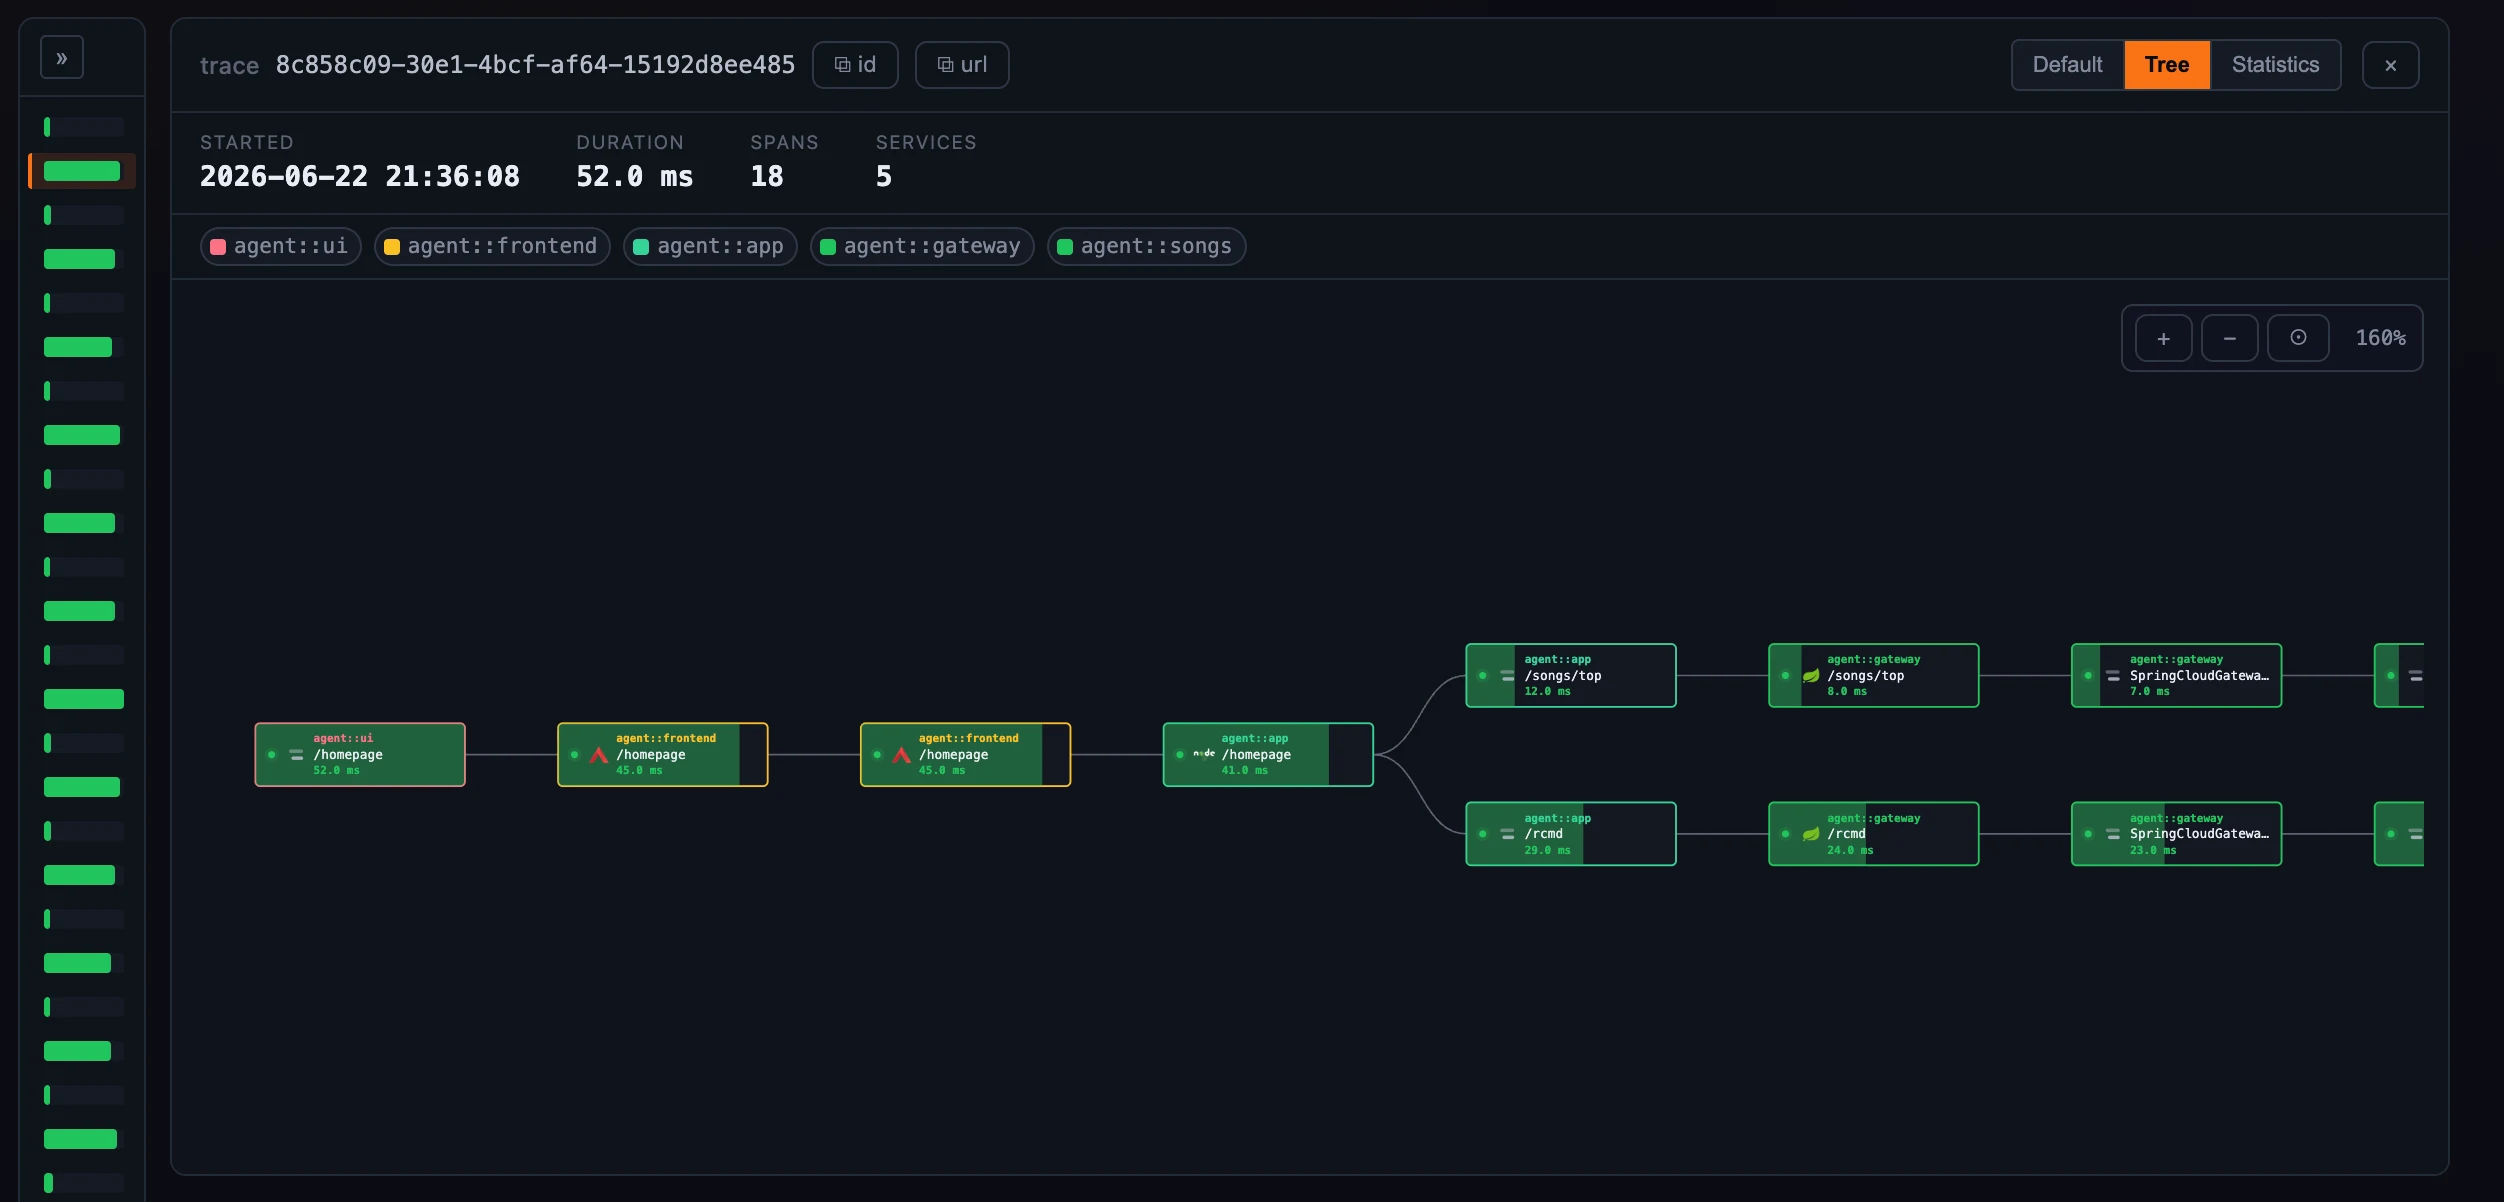 Figure 3: The Tree view — the same spans as the call tree’s shape, zoom and pan to explore.
Inside a span
Click any span and a detail panel opens beside it. Meta lays out the essentials — service, instance, endpoint, kind (entry / exit / local / producer / consumer), component, peer, layer, start time, duration, and the error flag. Below it, when they apply:
- Cross-trace refs — when a span’s parent lives in a different trace (an async hop, a message consumed later), the reference is listed with the parent’s trace id, segment, and span — and the trace id is a link that swaps you straight into that other trace.
- Tags, Logs (timestamped per-span entries), and Attached Events (named events with start/end times and summary key/values).
The detail header reports the trace’s start, total duration, span count, and how many distinct services it touched; from there you can copy the trace id or a shareable link. Opening a shared ?traceId=… URL lands you directly on that trace in an overlay — which is what makes a trace something you can paste into an incident channel and have a teammate land on the exact same view.
Native and Zipkin, side by side
Not every layer’s traces come from SkyWalking’s own agents. A layer template carries a traces.source setting — native, zipkin, or both — and Horizon routes accordingly. Agent-instrumented layers (like General Service) use the native explorer above; service-mesh and Kubernetes-flavored layers, where spans arrive as Zipkin/OpenTelemetry data, use the Zipkin explorer; and a layer set to both simply gets two sidebar tabs, since native and Zipkin spans have genuinely different shapes and conditions.
The Zipkin tab queries an upstream Zipkin store through OAP’s Zipkin query API (the same compatibility surface OAP exposes for any Zipkin client — not a GraphQL or TraceQL path). Because Zipkin organizes data by its own service universe (the serviceName on each span, which can drift from SkyWalking’s service list), the tab carries its own service controls instead of binding to the page’s service picker — with Zipkin-native conditions like Remote service, Span name, and an Annotations query (error or key=value). The two stores fail independently: if Zipkin is unreachable, the native traces are unaffected, and vice versa.
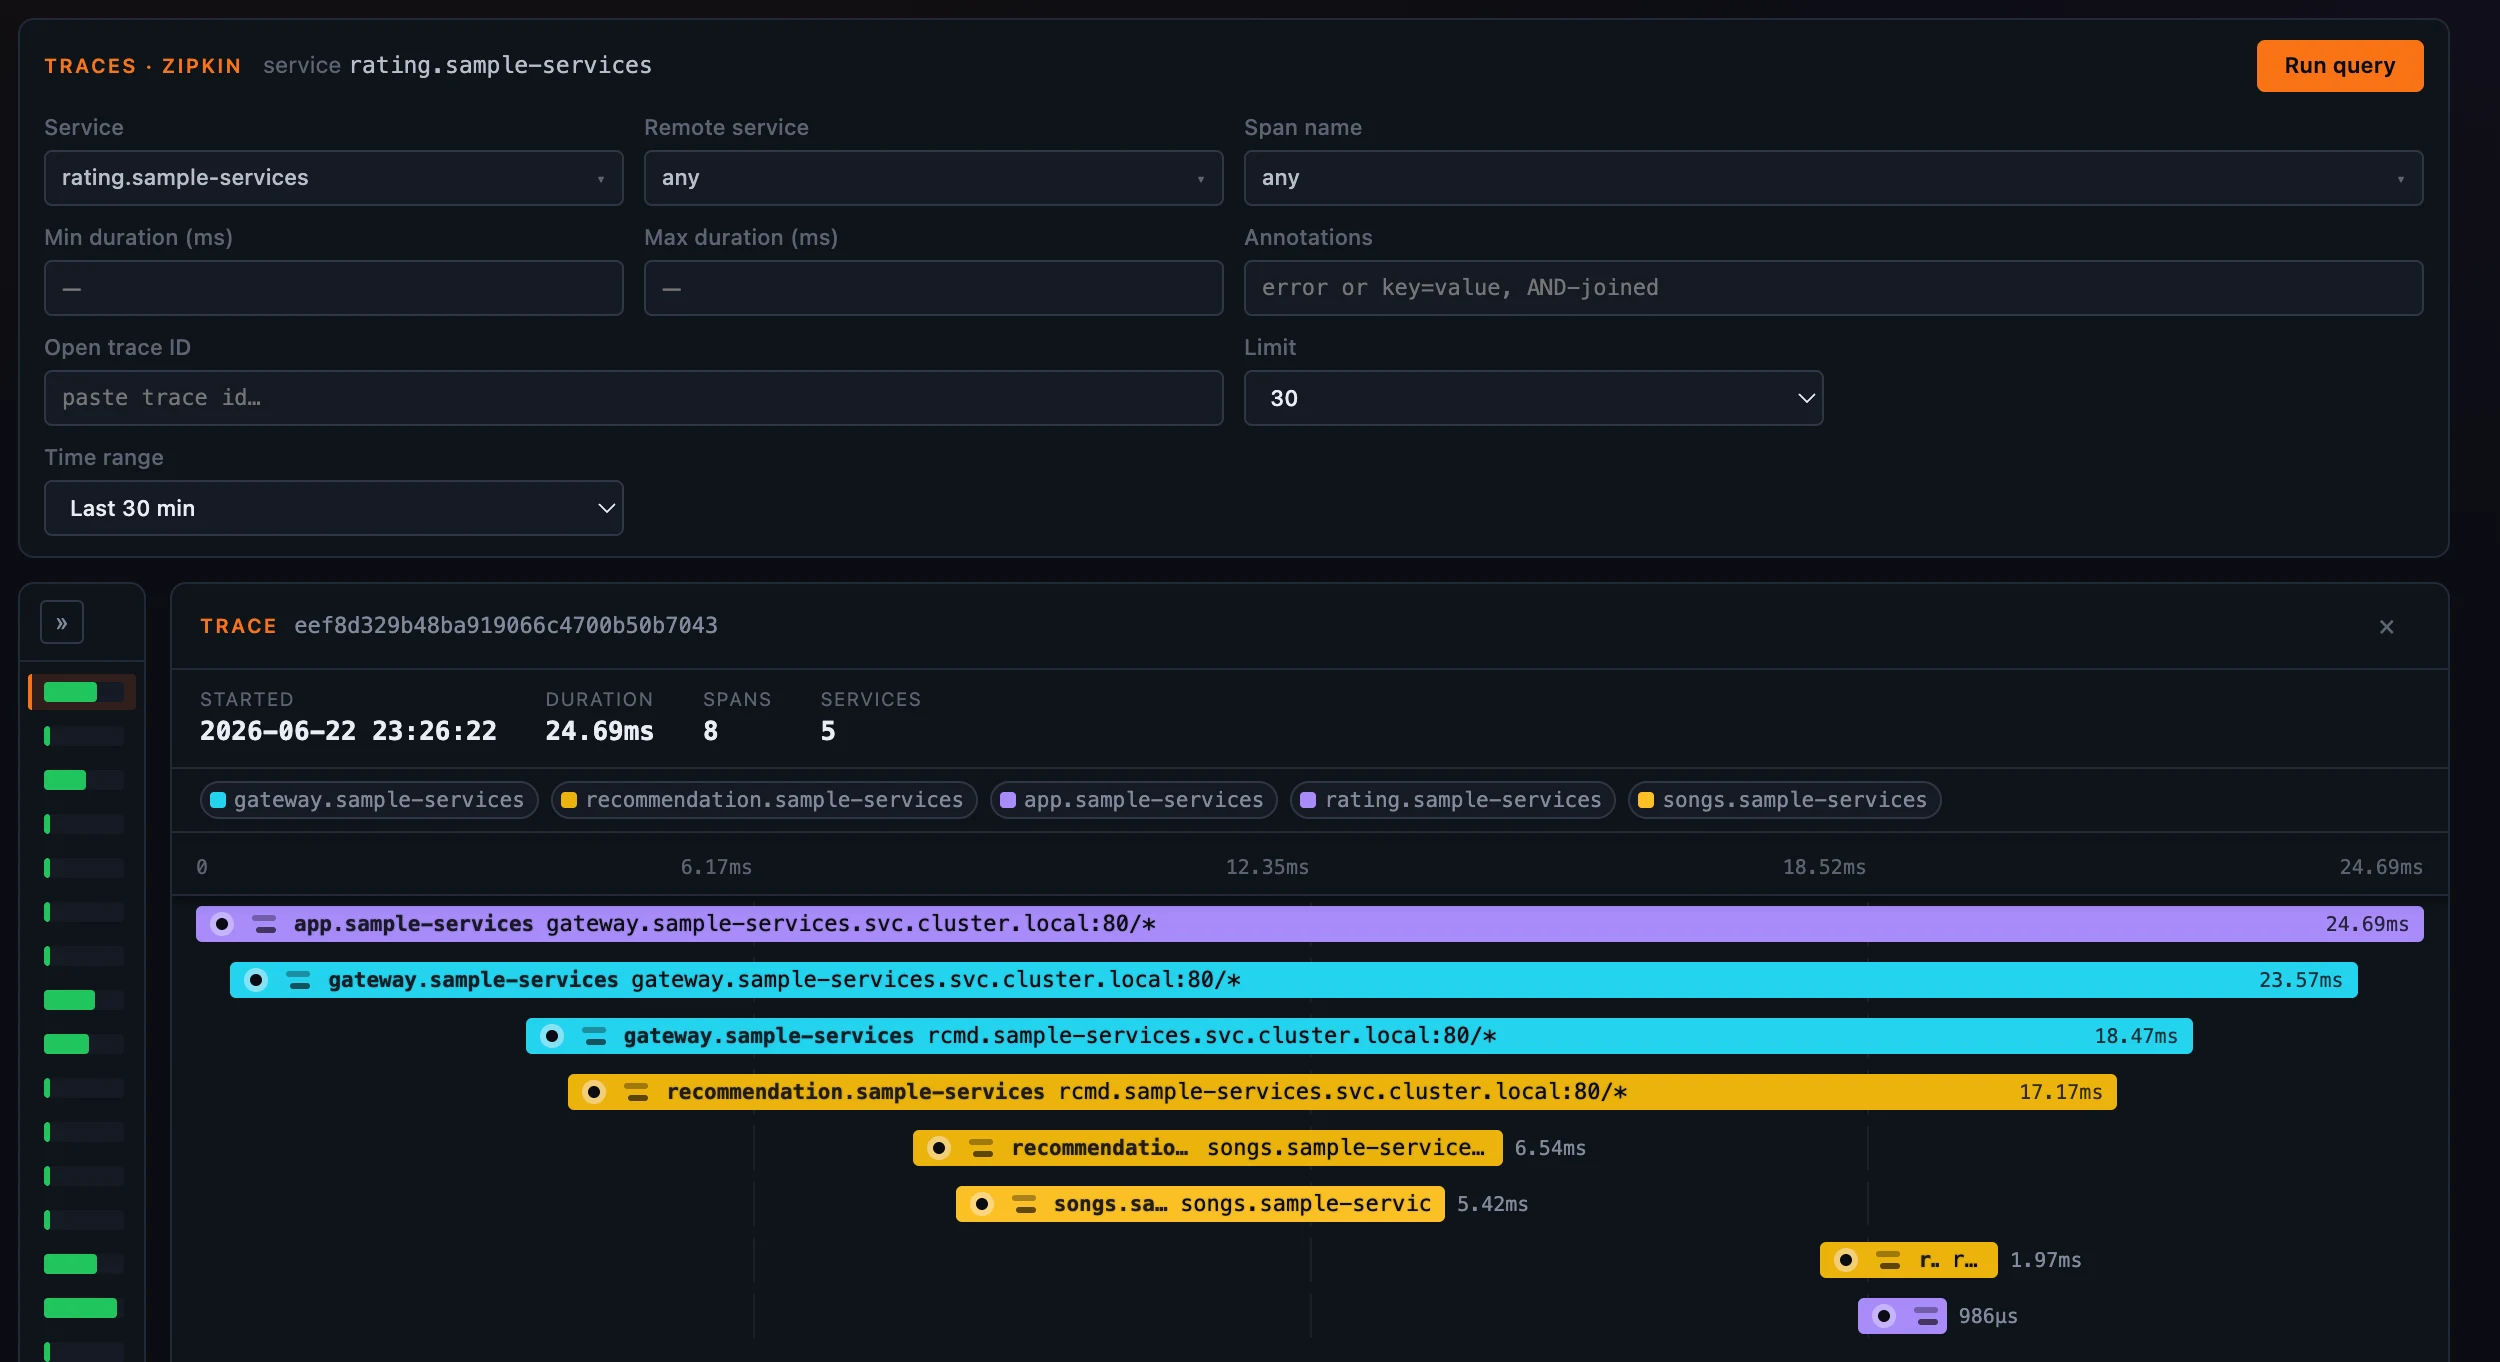 Figure 4: A layer set to Zipkin gets its own tab and its own service universe, querying the upstream Zipkin store through OAP.
Open a Zipkin span and its detail keeps that Zipkin shape — the CLIENT / SERVER kind, the local and remote endpoints, and the raw Zipkin/OpenTelemetry tags (the istio.* set, http.status_code, the sidecar node_id) exactly as Zipkin recorded them, with no translation into SkyWalking’s span model.
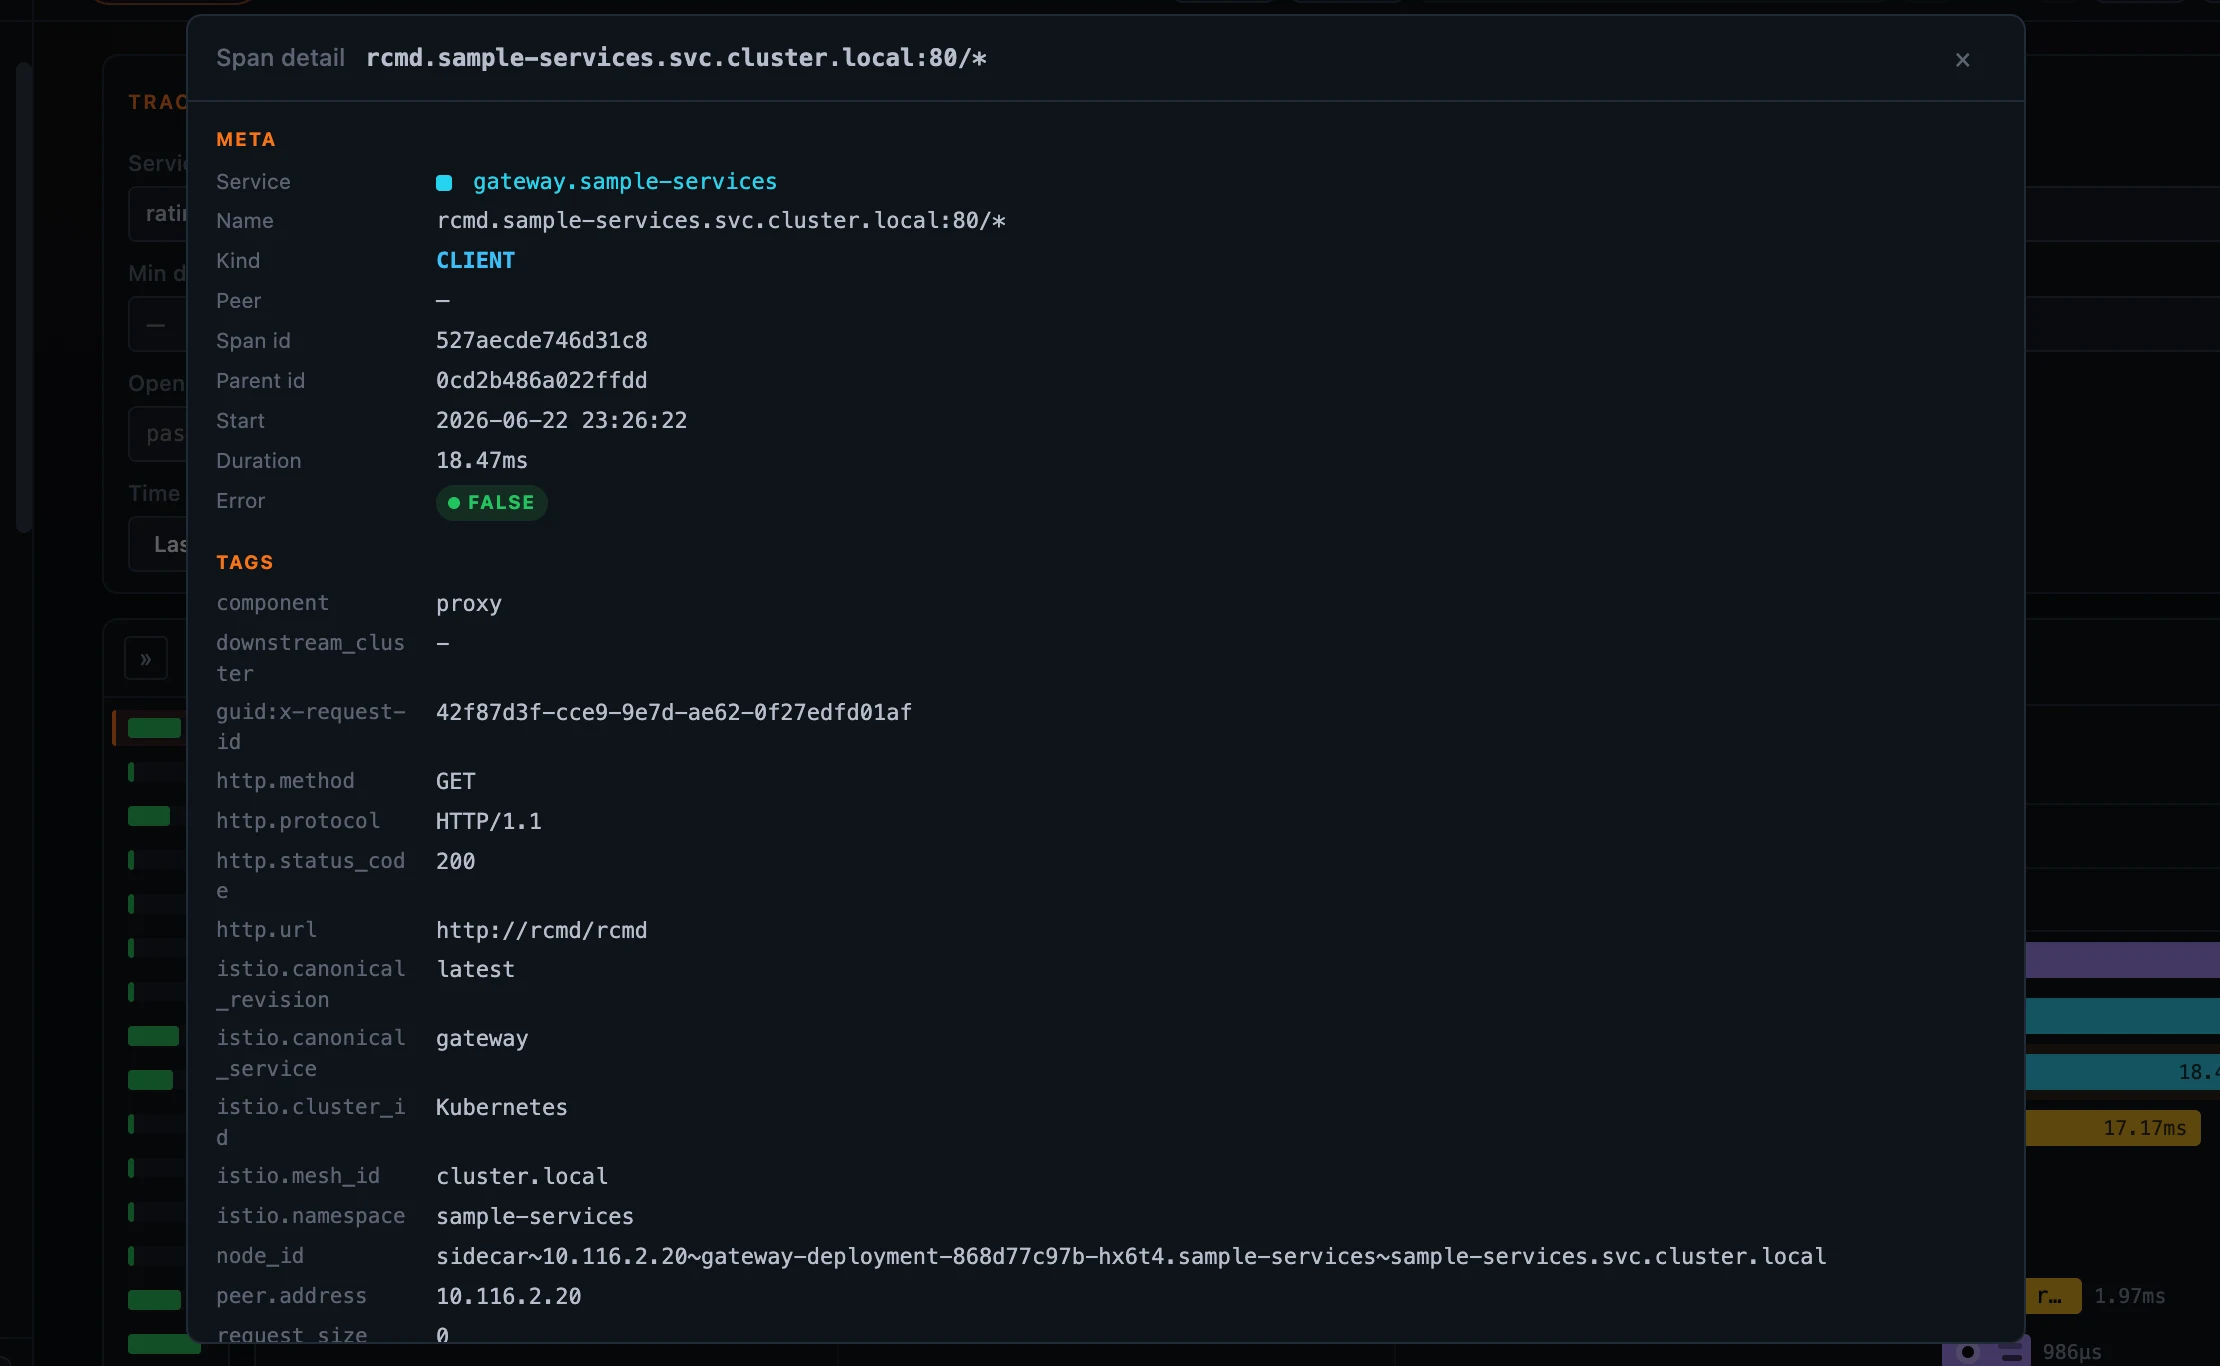 Figure 5: A Zipkin span keeps its native fields — the kind, the endpoints, and the raw
 istio.* / HTTP tags.
From a slow row to the trace behind it
There’s a second way into a trace that doesn’t go through the explorer at all. A trace overlay is mounted once for the whole app, and several things open it by trace id: a ?traceId= link, a cross-trace ref, a log line, and — as Part 2 showed — the jump-to-trace icon on a record widget’s slow-statement row. Because it resolves by id rather than by layer, it works even when the trace belongs to a different layer than the one you’re looking at: a Virtual Database, Cache, or MQ service has no traces tab of its own, yet its slow statement still lands you on the originating trace. And when the jump carries a timestamp (a log row knows when its line was written), the lookup widens around that moment — so a trace that has already aged into cold storage still resolves instead of quietly missing.
Where to go next
The Traces tab is one request in full detail; the dashboards and maps from the earlier posts are where you notice something’s wrong in the first place. For the field reference — every condition, the native-vs-Zipkin split, the span detail panel — see the Traces docs.
Next up: the Log Explorer — the same triage instincts, applied to log streams instead of spans.