Meet Horizon UI · 10/17: Alarms & Incident Triage
This is the tenth post in the Meet Horizon UI series, and the first of Act 3 — operate it. The earlier posts were about seeing your data — dashboards, topology, traces, logs, profiles. This one is about the moment something breaks, and Horizon’s answer to the only two questions that matter then: what is on fire right now, and why?
The alarm surface is built around two ideas: incidents, not a wall of events, and replaying the exact metric snapshot that fired the rule.
Incidents, not a wall of events
OAP emits an alarm event every time a rule trips. A flapping rule on a busy service can fire dozens of times an hour, and a raw event feed buries the one new problem under a hundred repeats. Horizon groups those events the way an on-call engineer already thinks about them — by (entity, rule). Every firing of “response time of agent::gateway is more than 20ms” is the same incident, however many times it tripped.
So the Alarms page (top nav) is a list of incidents, not events. The KPI strip counts the active ones — total and per layer — and each row carries the entity, the rule’s message, its layer, and a triggered N× badge when it re-fired. An incident is in one of three states:
- firing — the latest event has not recovered;
- recovered — the condition cleared; these drop out of the active counts but stay visible as recent history;
- unstable — it fired, recovered, then fired again. That badge is how a noisy, oscillating rule outs itself.
The page also owns its own time window — 20m / 2h / 4h presets, or a custom range up to four hours — independent of the global topbar. You can rewind two hours of alarm history without disturbing the dashboard you were on.
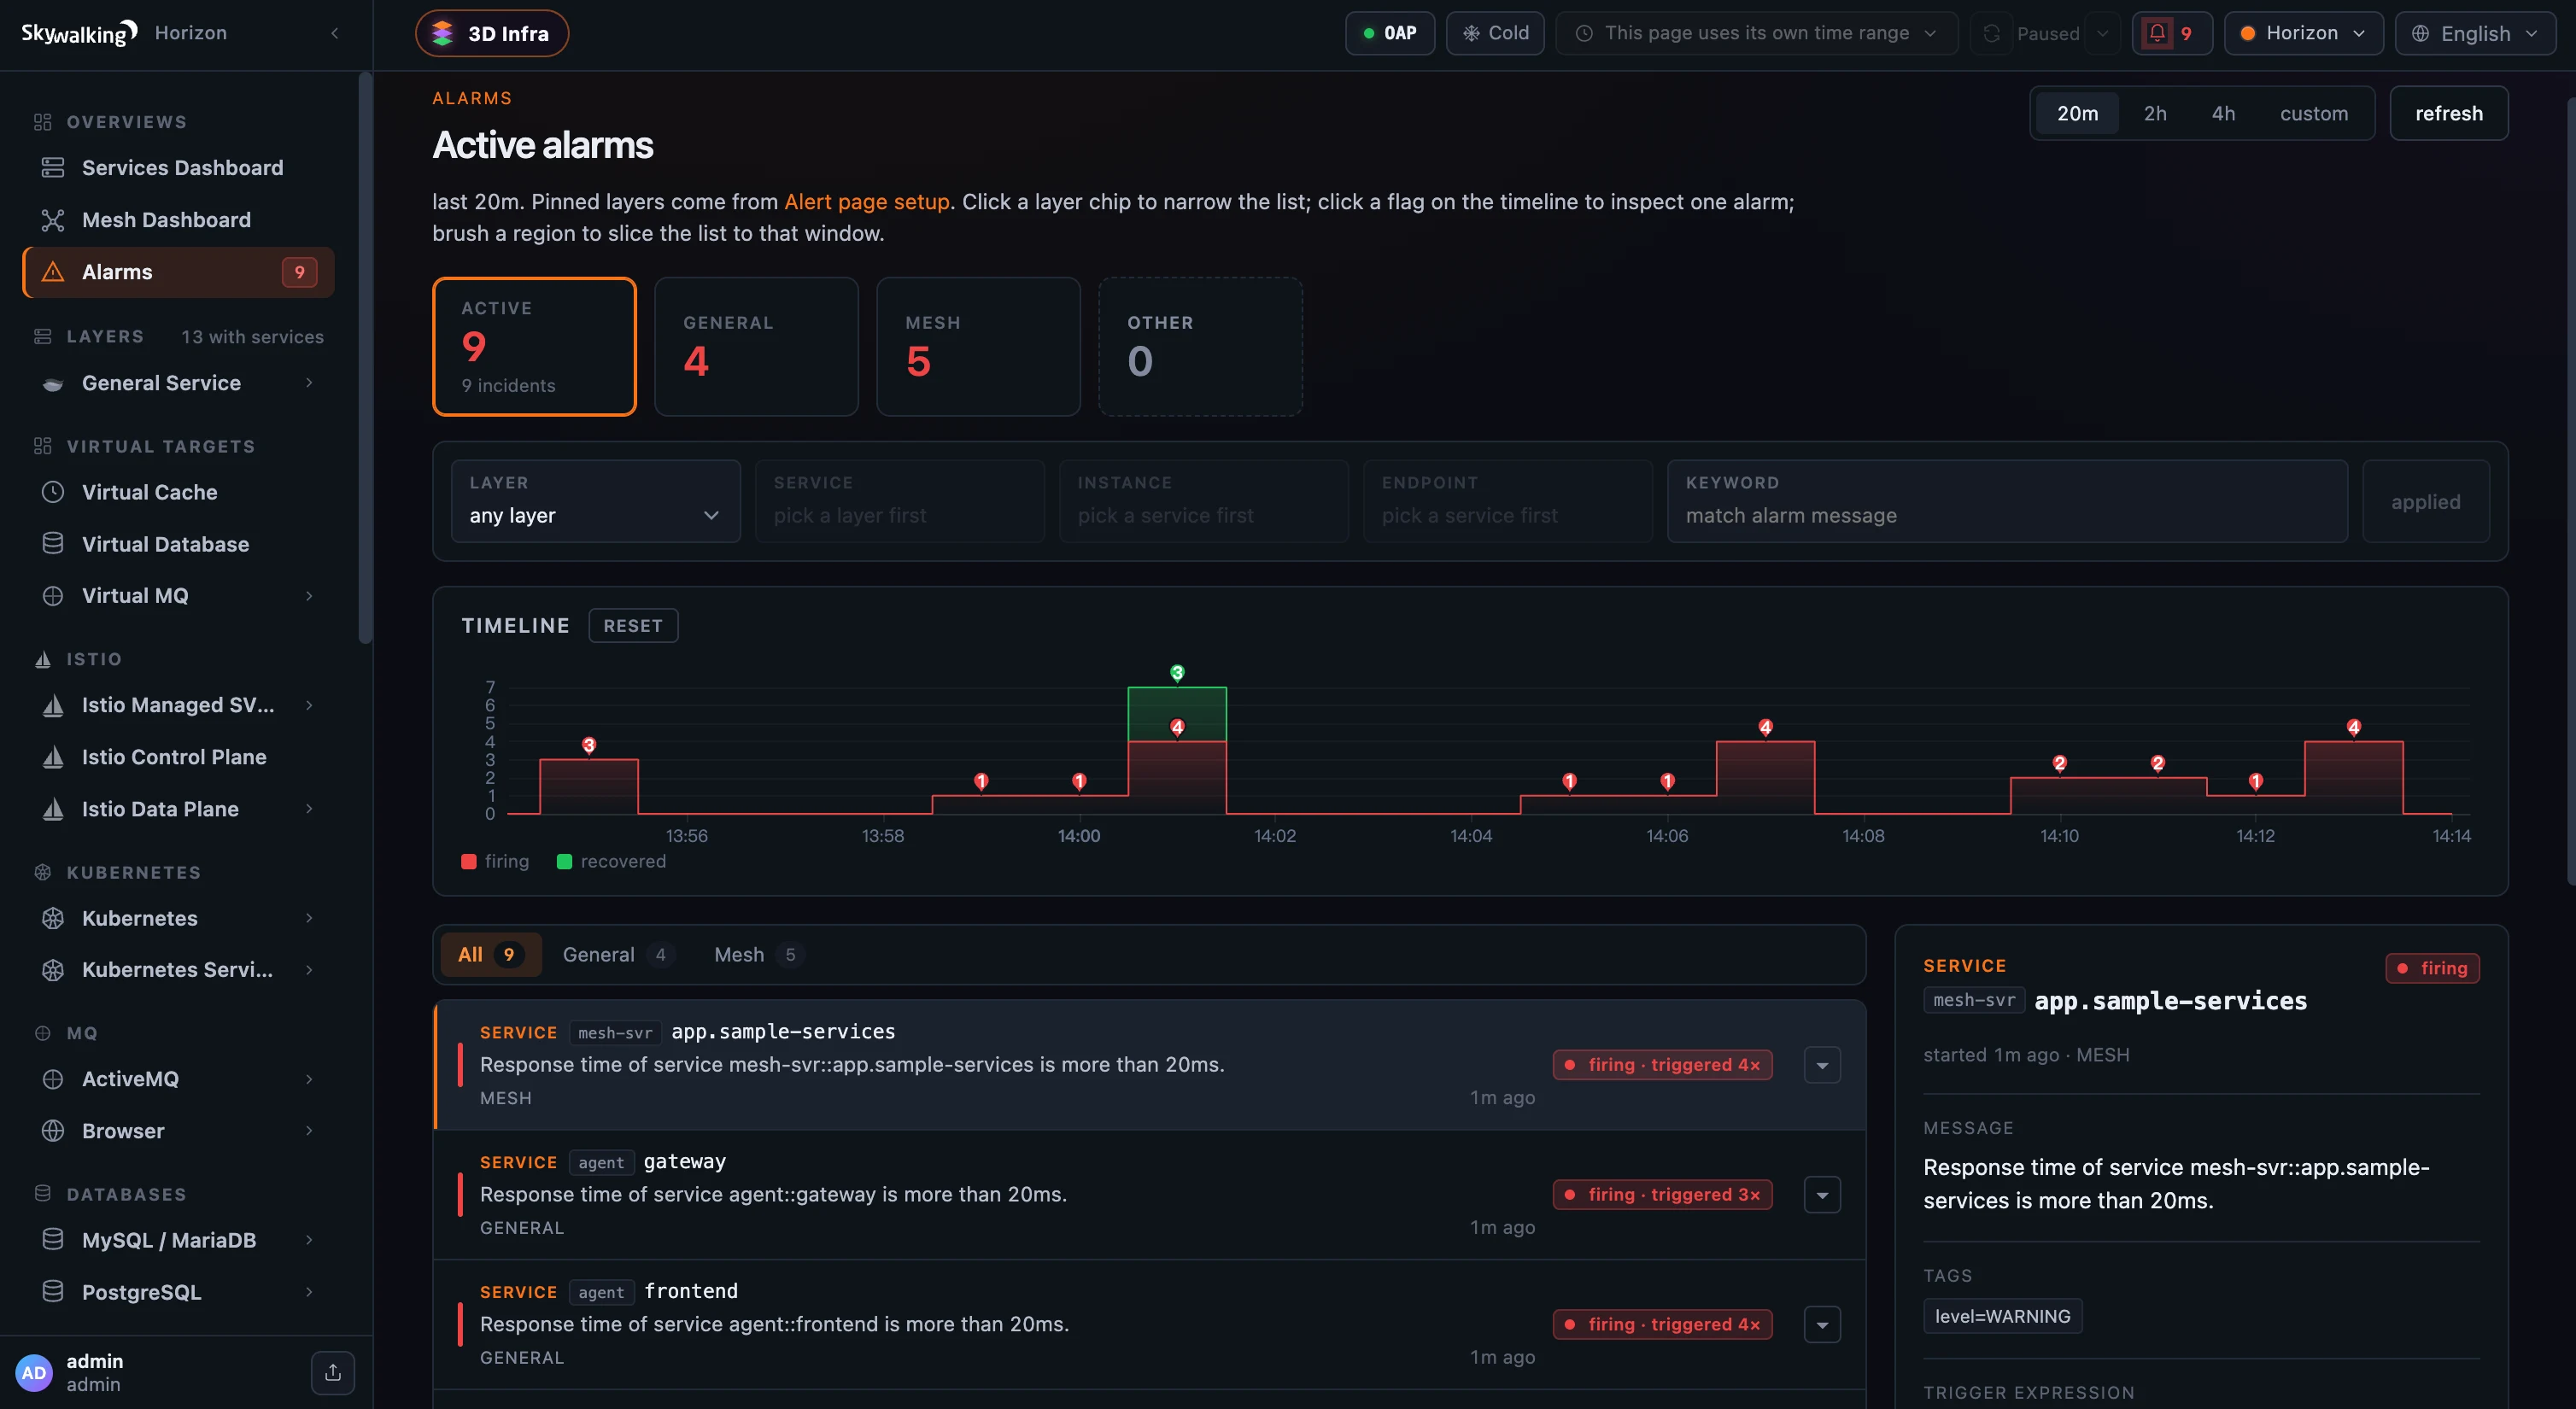 Figure 1: Nine active incidents, not a flood of raw events — each row is one (entity, rule) pair, re-fires folded into a
 triggered N× badge, with the firing/recovered rhythm on the timeline above.
Replay why it fired
Click an incident and the detail panel does something most alarm consoles can’t: it replays the evidence. Alongside the entity, the firing pill, the message, and the tags, it shows the rule’s trigger expression — the MQE that defines it, here sum(service_resp_time > 20) >= 1 — and the metric snapshot OAP captured at the moment it fired.
That snapshot is the real metric values from the rule’s evaluation window, one per minute bucket, drawn back onto a real-time axis with the trigger moment marked and the window shaded. You see exactly what crossed the threshold — no re-opening a dashboard and guessing which spike was the culprit. The alarm carries its own proof.
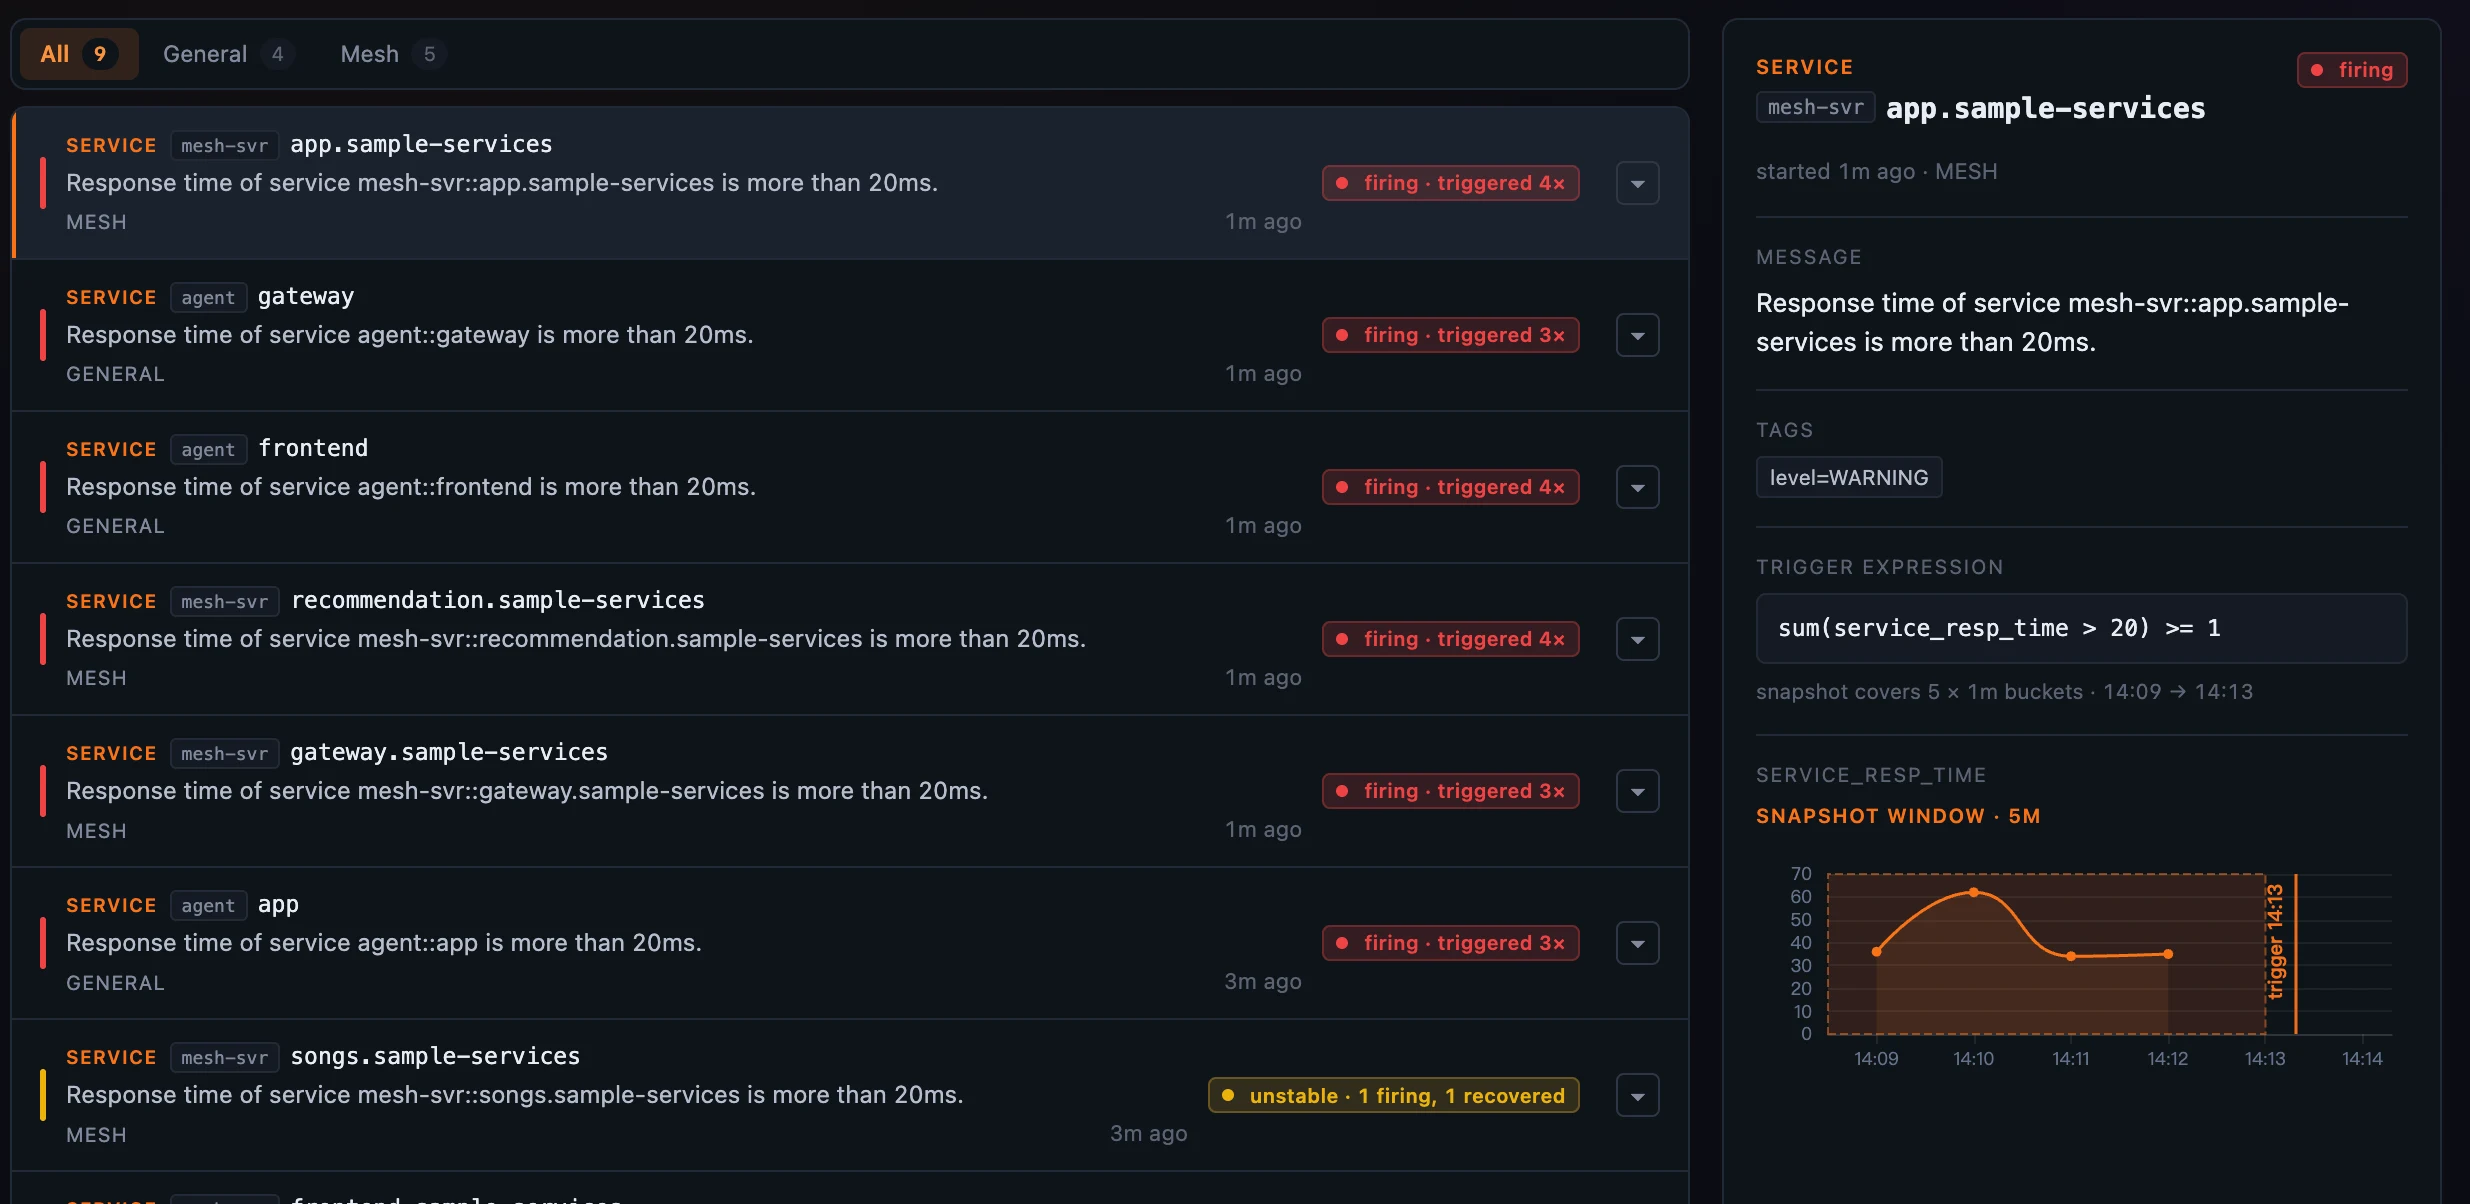 Figure 2: The replay — the rule’s MQE expression and the exact values OAP captured at fire time, the five-minute snapshot window shaded (14:09→14:13) and the trigger moment marked. The list at left even tags one rule
 unstable · 1 firing, 1 recovered — a flapper caught mid-oscillation.
From one incident to its whole history
A triggered N× row expands. Click the chevron and the incident unfolds into its firing history — #1 twenty-one minutes ago, #2 fifteen, and so on — each firing (and recovery) in order, so you can tell a rule that flapped a few times from one that has been down solidly since the first alert.
The timeline above the list tells the same story at a glance: per-minute columns, red for firing and green for recovered events, each with a count. Click a flag to jump to that minute’s alarm; drag to brush a region and slice the list to that window — the timeline keeps every point visible, so a second spike never hides behind the first.
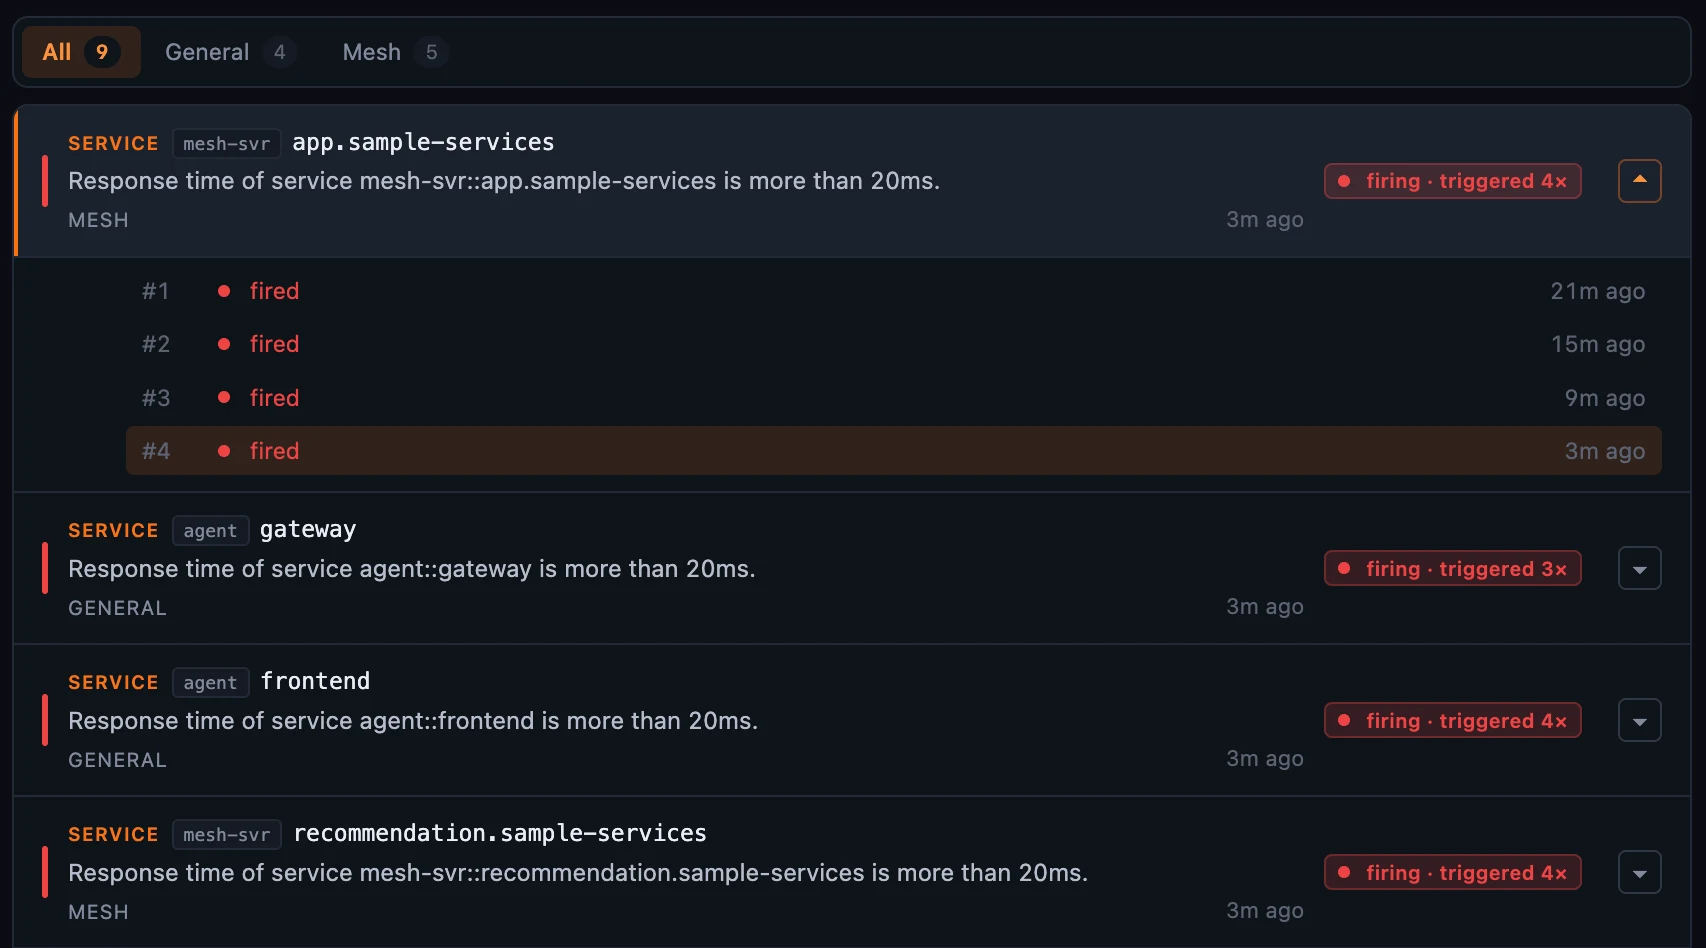 Figure 3: Expand a
 triggered 4× incident to see each firing in order — #1 twenty-one minutes ago through #4 three minutes ago — instead of four rows scattered down the page.
Alarms follow you everywhere
The same incident model isn’t trapped on the Alarms page; it surfaces wherever you are:
- the topbar badge polls every minute over a rolling 20-minute window and turns red with the active-incident count, so a new problem reaches you on any screen;
- the Active alarms dashboard widget lists the current incidents, its title carrying the window (
· last 20m) so “nothing here” is never ambiguous; - and on the service topology and the 3D Infrastructure Map, firing services light up red.
Every one reads the same rolling window and the same (entity, rule) merge, so the number on the badge, the rows in the widget, and the red nodes on the map always agree.
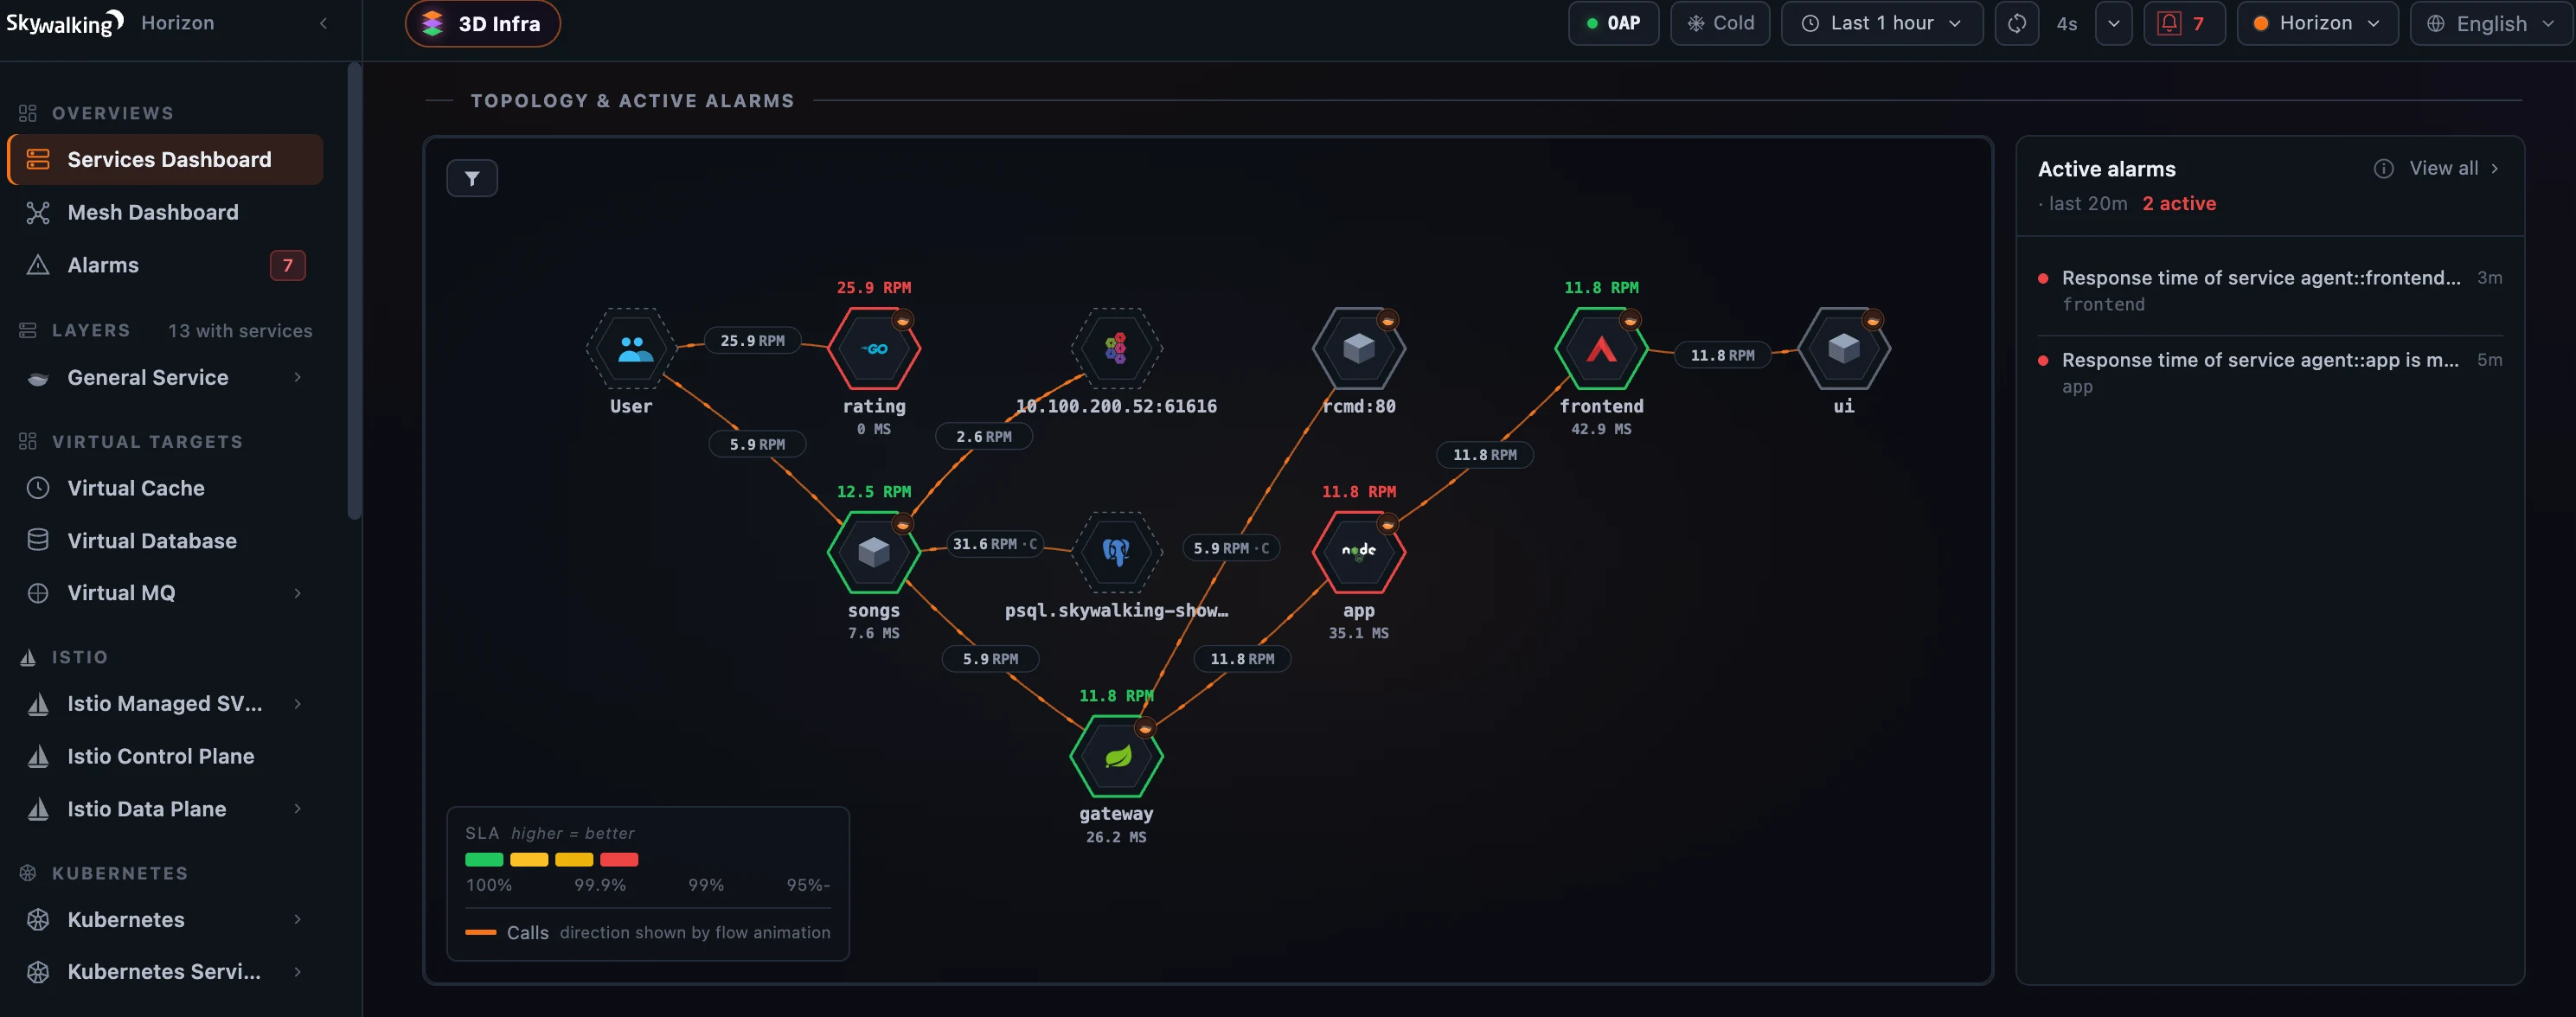 Figure 4: The same incidents everywhere — the topbar badge, red-ringed services on the topology, and the Active alarms widget, all reading one shared 20-minute window.
Where it runs, and what it isn’t
Reading active alarms is pure observe — it streams off OAP’s query host and works on today’s OAP with nothing to enable; viewing is gated on the alarms:read permission. You can narrow the list by keyword, and — where your OAP exposes the newer alarm query — by layer and entity.
Two deliberate non-features are worth calling out. Horizon alarms are a read-only mirror of OAP’s evaluation state: there is no acknowledge-and-dismiss, and an incident recovers when the condition actually clears — so the page is always the truth, not a worklist someone forgot to tidy. And you don’t edit alarm rules here; rules live in OAP’s alarm-settings.yml. The live rule context — which OAP node is evaluating each entity, and its silence and recovery-observation countdowns — belongs to the Alerting Rules surface, which rides OAP’s admin host and is the subject of the next post.
Where to go next
For the field reference — the window cap, the snapshot internals, and the pinned-layer setup — see the Alarms docs.
Next up: Runtime Rules & Live Debugging — editing OAL / MAL / LAL against live samples through OAP’s admin host, the part of “operate” the open-source backend only just made possible.